Previous: (y-12) Haptics | AR Index
Mental Model First
- Immersive systems are evaluated with experiments on human subjects, following the scientific method: hypothesis, manipulated independent variables, measured dependent variables, analysis. People differ wildly (VR experience, sickness susceptibility, suspicion of technology), which is what makes this hard and ethics necessary.
- Distinguish evaluation OF VR/AR (is my immersive system good?) from evaluation WITH VR/AR (using VR/AR as a controlled instrument to study another question, or to simulate what would be technically or ethically impossible otherwise).
- Every hypothesis must be turned into a measurable quantity: “learn faster” becomes task completion time, “score higher” becomes test score, “feel less tired” becomes task load. Standard questionnaires exist for the recurring measures: SSQ for sickness, SUS for usability, NASA TLX for task load.
- Self-reported metrics are biased and unreliable, the novelty effect inflates results for shiny new technology, and confounding variables fake correlations. The countermeasures are protocols, pilot studies, longitudinal designs, control variables, and proper statistics (descriptive versus inferential).
- The future-trends half is a tour: better displays (varifocal, accommodation-vergence solutions), more senses (touch, smell, taste), AR for smart objects and robots, brain-machine interfaces, ML/AI turning graphics and vision upside down, semantic scene understanding, and open standards.
1. Why Evaluate Immersive Systems
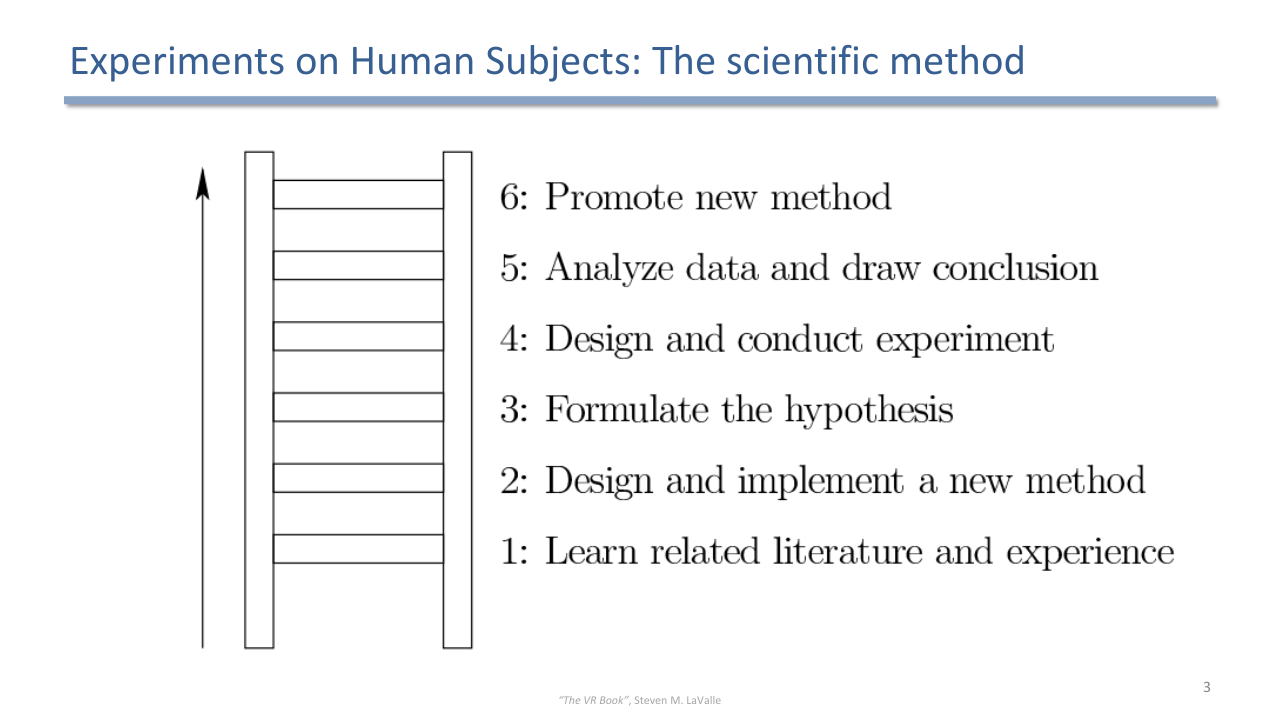
Experiments on human subjects follow the scientific method: observation, hypothesis, prediction, experiment, analysis, and iteration.
User evaluation serves two goals:
- Understand the fundamentals: How can AR/VR be used? When and where does it become more effective or efficient than other technologies?
- Gain insights: What makes one immersive system work better than another? Do we really need to make this immersive? Which design guidelines can be inferred from an empirical study?
There are also pragmatic reasons: head-mounted displays can cause more stress than 2D technologies, and since the devices are still new, it is important to know how users actually behave with them. Evaluating is also good practice in general.
2. Experiments on Human Subjects
Working with people brings specific difficulties:
- Human subjects differ wildly in prior VR experience, susceptibility to motion sickness, and suspicion of technology.
- Ethical standards: experiments affecting privacy or health must be avoided; human experiments often require approval by a committee (ethics board).
- Variables:
- Dependent variables: the measures used to test a hypothesis.
- Independent variables: the conditions directly manipulated by the scientist.
A useful distinction: evaluation of VR/AR examines the immersive system itself, while evaluation with VR/AR uses the technology primarily to study another question, for example using VR as a controlled environment to study AR first, or simulating environments to study questions that would be technically or ethically impossible otherwise.
3. The Method Toolbox
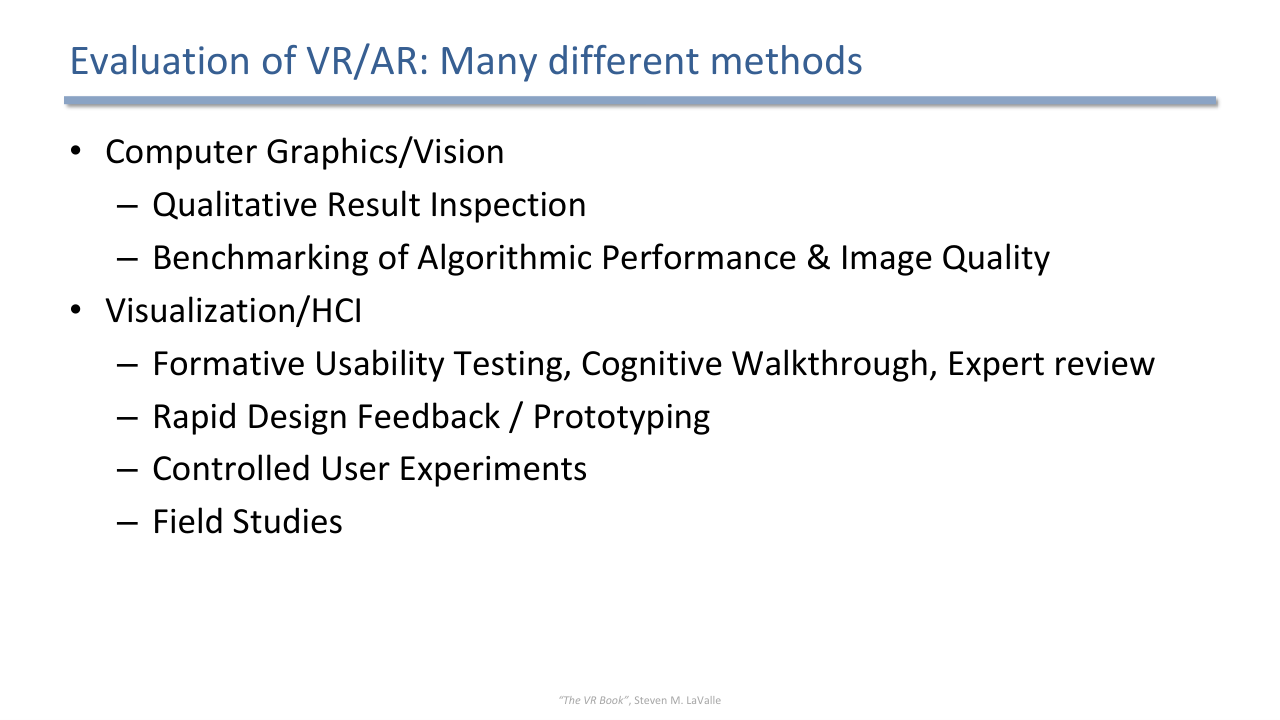
Evaluation methods span two cultures: computer graphics/vision (qualitative result inspection, benchmarking of algorithmic performance and image quality) and visualization/HCI (usability testing, cognitive walkthrough, expert review, prototyping, controlled experiments, field studies).
VR/AR inherits evaluation methods from two research cultures:
- Computer graphics / vision: qualitative result inspection; benchmarking of algorithmic performance and image quality.
- Visualization / HCI: formative usability testing, cognitive walkthrough, expert review; rapid design feedback and prototyping; controlled user experiments; field studies.
Where to start: know your participants through demographic evaluation: age, gender, nationality, side preference (left- or right-handed), sight correction, language.
4. From Question to Measure
Decide what to evaluate based on what you want to find out. Each expectation about the system must be operationalized as a measurement:
- “Participants using VR will learn faster than participants using paper tutorials” → measure task completion time.
- “Participants using AR will score higher in the test” → measure their score.
- “Participants using VR will feel less tired when performing the task” → measure task load / effort.
The Novelty Effect
Does the user like the VR application because it is shiny and new, or because it is actually helpful for the use case? This is the novelty effect. It can be overcome with repeated exposure, such as longitudinal studies, and it can also distract the study conductor, so a fixed protocol must be followed.
5. Comfort and VR Sickness
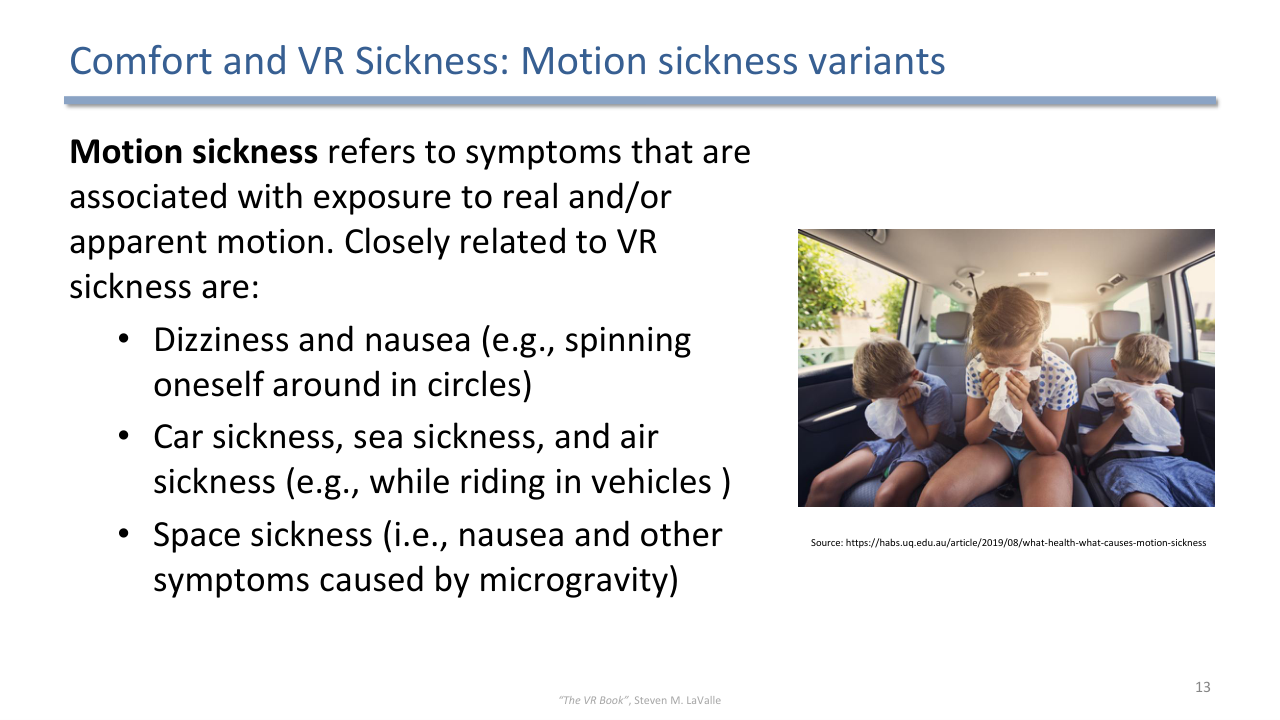
Motion sickness covers symptoms associated with real and/or apparent motion; VR sickness is closely related to dizziness and nausea from spinning, car/sea/air sickness, and space sickness from microgravity.
Motion sickness refers to symptoms associated with exposure to real and/or apparent motion. Closely related to VR sickness are dizziness and nausea (spinning oneself in circles), car, sea, and air sickness (riding in vehicles), and space sickness (microgravity). The common symptoms of VR sickness:
- Nausea: unpleasant sensations in stomach, upper abdomen, esophagus, or throat.
- Dizziness: sensations of spinning, tumbling, or swaying, even after the stimulus is removed.
- Drowsiness: reduced alertness, yawning, eventually falling asleep.
- Headache: gradually increasing, possibly persisting long after use.
- Fatigue: tiredness or exhaustion after long experiences.
- Eyestrain: eyes feel tired, fatigued, sore, or aching.
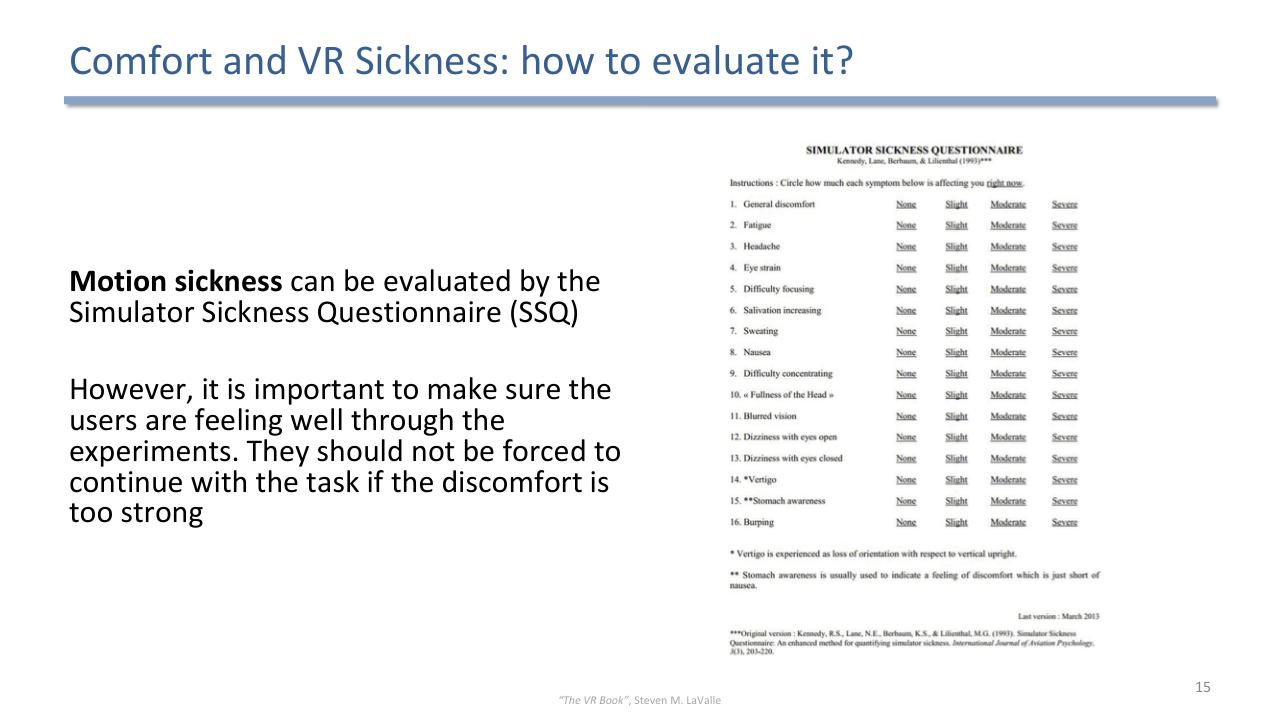
The Simulator Sickness Questionnaire (SSQ) is the standard instrument for evaluating motion sickness; participants must never be forced to continue when discomfort is too strong.
Motion sickness is evaluated with the Simulator Sickness Questionnaire (SSQ). Just as important as measurement: make sure users are feeling well throughout the experiment, and never force them to continue a task when the discomfort is too strong.
6. Usability and Task Load Instruments
Usability questions for immersive systems: Can people use the system without verbal explanation? How easy is the interface to navigate? Specifically for HMDs: can the experimenter easily see the user’s perspective during the study?
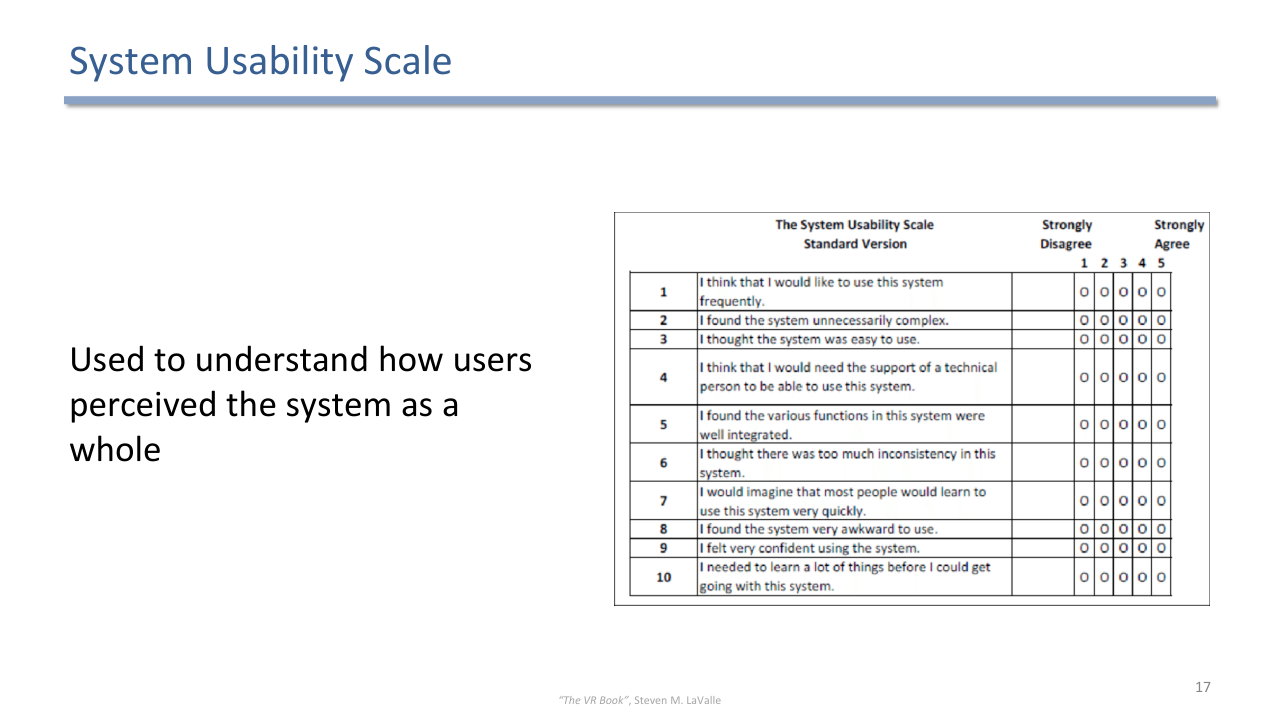
The System Usability Scale (SUS): ten alternating positive and negative statements on 5-point scales, yielding a 0-100 score of how users perceived the system as a whole.
The System Usability Scale (SUS) is used to understand how users perceived the system as a whole: ten standard statements scored into a 0-100 usability score.
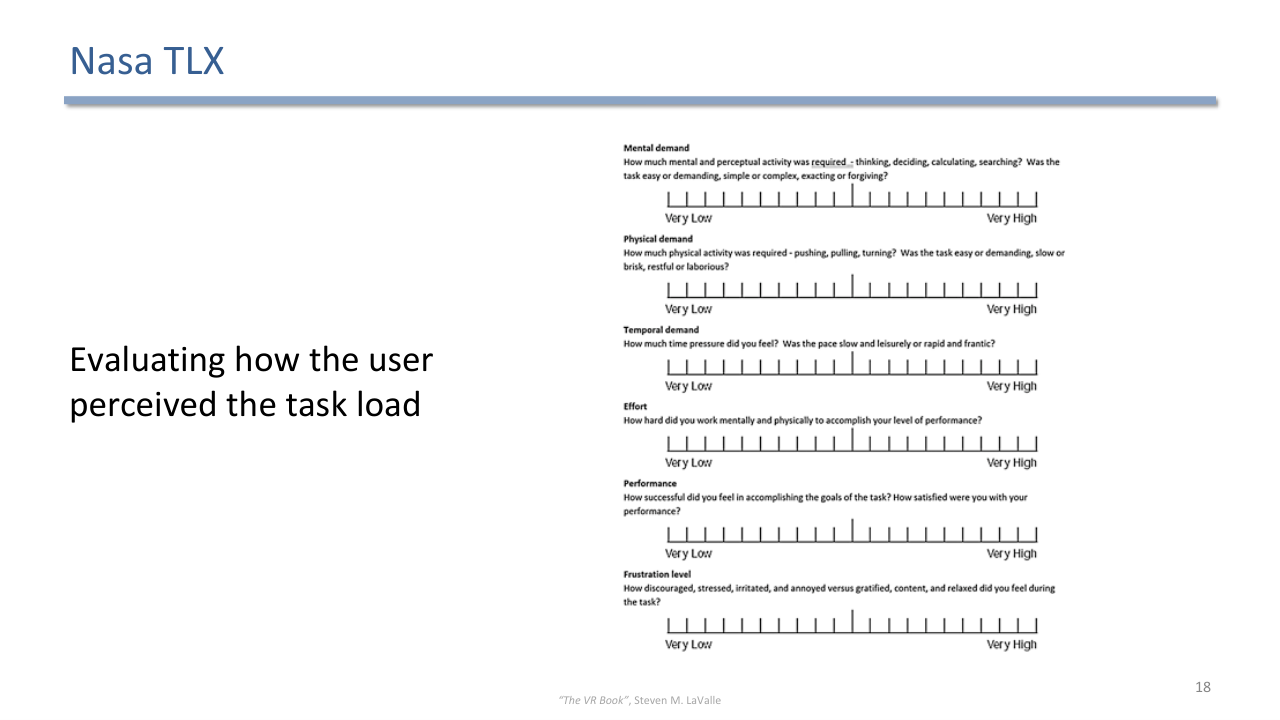
NASA TLX evaluates perceived task load on six subscales: mental, physical, and temporal demand, performance, effort, and frustration.
The NASA TLX (Task Load Index) evaluates how the user perceived the task load, across mental demand, physical demand, temporal demand, performance, effort, and frustration.
Interviews
Interviews are usually a good idea for understanding nuances. Users report on their experience after the study; methods such as coding extract information from the transcripts; optimally, interviews are paired with video recordings of the participant’s performance, and for AR/VR it is good practice to record what the participant sees in the virtual (part of the) world.
Limits of Self-Report
Self-reported metrics have systematic weaknesses:
- Users can be unreliable, and there is always a bias.
- Sometimes order matters (see “stereotype threat”).
- Users may be too tired to give complete answers by the time of the interview.
- Cultural differences can impact results.
- The mitigation: evaluate with as many people as possible.
7. Ethics, Pilots, and Good Practices
Data and user protection: participants’ information must be protected. Universities regulate user studies in their code of conduct, and running one requires authorization evaluated by the ethics board, which ensures participants are not endangered and are aware of their rights before taking part.
Pilot studies with 3-5 participants refine the design: are results reasonable, is the task too easy or too hard, how long does a participant take? If possible, refine and pilot again.
Pilot studies use a small number of participants (3 to 5) to refine the design: Are the results reasonable? Is the task too easy or too hard for reasonable results? How long does one participant take? If possible, refine and pilot again.
Good practices during the study:
- Remove distractions: cell phones off, only relevant equipment on the table.
- Do not influence participants: careful answers to questions, no leading questions.
- Do not underestimate exhaustion: plan resting periods.
8. Analyzing the Data
With the data collected, the goal is to answer the study questions. Example: “Younger participants will select the correct answer faster than older ones” → select the age threshold, calculate each group’s completion time, compare and check whether the values differ.
- Descriptive statistics: central tendency (mode, mean, median), variability (range, variance, standard deviation), measures of relationships (correlations).
- Inferential statistics: statistical tests to find significances (t-test, ANOVA, …), parametric and non-parametric tests. Analyzing confidence intervals is a good alternative (see Cockburn et al., “Threats of a replication crisis in empirical computer science”, CACM 2020).
Hypotheses are tested with statistics selected by data type (e.g. ANOVA). Control variables are fixed by subject selection (more confidence, less generalization); confounding variables make independent and dependent variables spuriously correlated, like ice cream sales and shark attacks connected by the weather.
Beyond independent and dependent variables:
- Control variables are fixed through the selection of subjects or trials, for example using only males aged 18 to 21 to hold variance low. This increases confidence in the results but decreases generalization.
- Confounding variables cause the independent and dependent variables to be correlated, with the correlation vanishing once the confounder is known. Classic example: ice cream sales and shark attacks, connected by the weather.
Exploratory Evaluations
Sometimes we do not yet know what questions to ask. Exploratory evaluations try out systems with participants to uncover unknown issues and to help formulate hypotheses; their outcome is usually the set of questions to confirm later with a confirmatory approach. Exploratory studies should still be conducted in a structured, reproducible way.
💡 Intuition
The whole methodology section compresses into one pipeline: question → hypothesis → measurable dependent variable → manipulated independent variable, with everything else (control variables, protocols, pilots, ethics approval) existing to keep noise, bias, and harm out of that pipeline, and statistics existing to decide whether the observed difference survives the remaining noise.
9. Case Study: Asymmetric AR Assembly
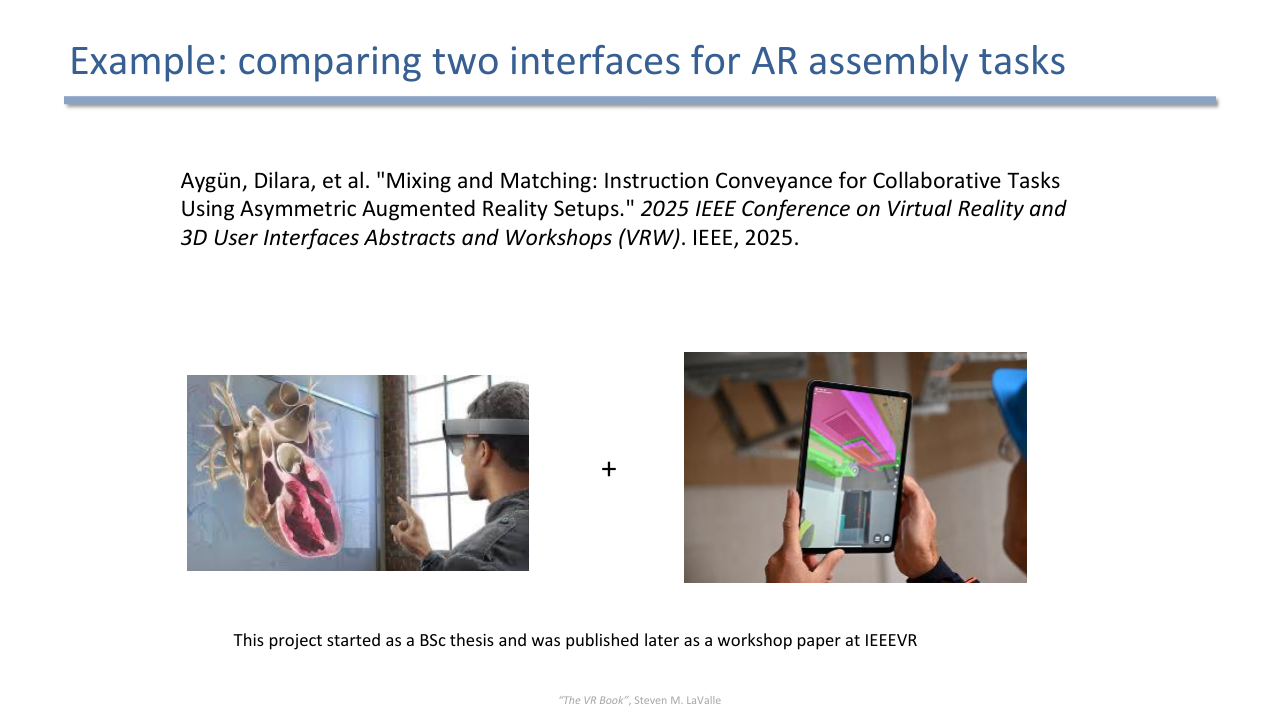
Case study: comparing two interfaces for AR assembly tasks (Aygün et al., IEEE VRW 2025) - instruction conveyance for collaborative tasks using asymmetric AR setups; started as a BSc thesis, published as a workshop paper.
The lecture’s worked example: comparing two interfaces for collaborative AR assembly tasks (Aygün et al., “Mixing and Matching: Instruction Conveyance for Collaborative Tasks Using Asymmetric Augmented Reality Setups”, IEEE VRW 2025), a project that began as a BSc thesis and was later published as a workshop paper at IEEE VR. Participants performed sorting and assembly tasks using a handheld display (HHD) versus a head-mounted display (HMD), with SUS, NASA TLX, and task questions as measures.
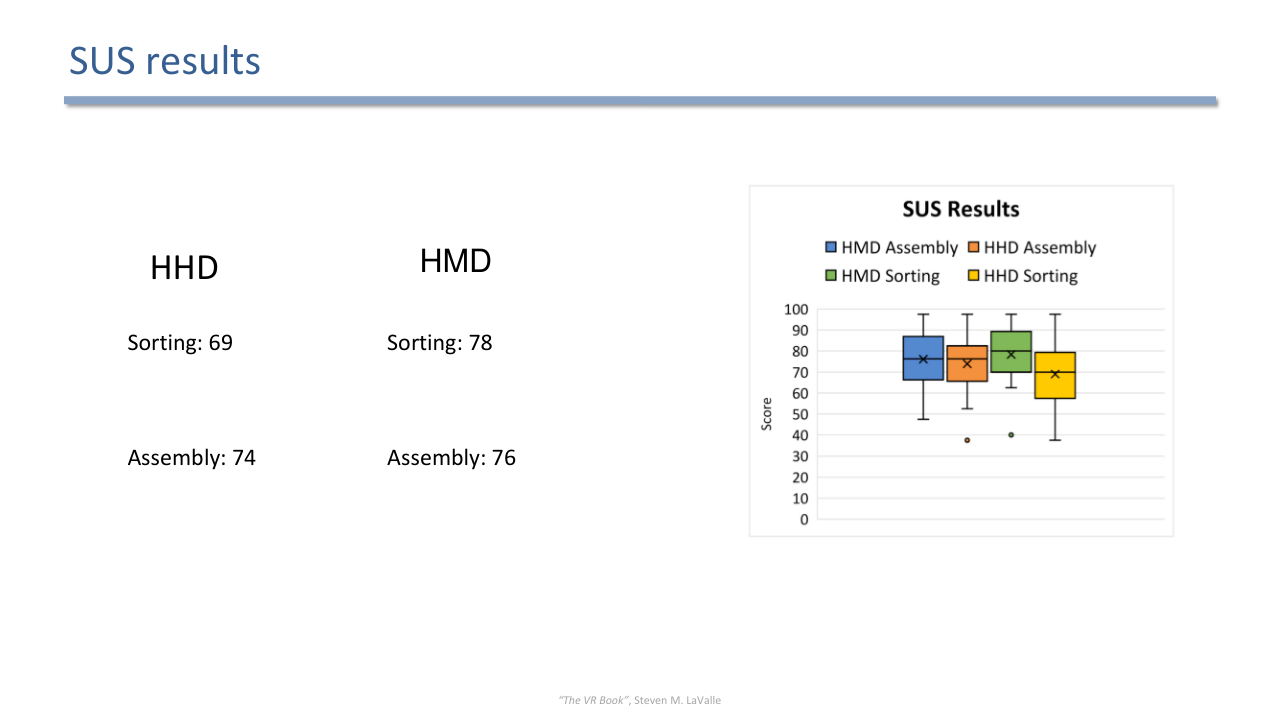
SUS results of the case study: HHD scored 69 (sorting) and 74 (assembly); HMD scored 78 (sorting) and 76 (assembly).
The SUS results: HHD reached 69 for sorting and 74 for assembly; the HMD reached 78 for sorting and 76 for assembly. The takeaways:
- Users preferred the HMD for tasks requiring more object handling (such as sorting), since it keeps the hands free.
- Side effects such as physical discomfort and UI interaction difficulties varied from participant to participant.
- The complexity of the task directly impacts the interaction and the choice of interface.
More depth on evaluation methodology is offered in the course Theoretical and Methodological Foundations of Visual Computing (TMFVC).
10. Future Trends
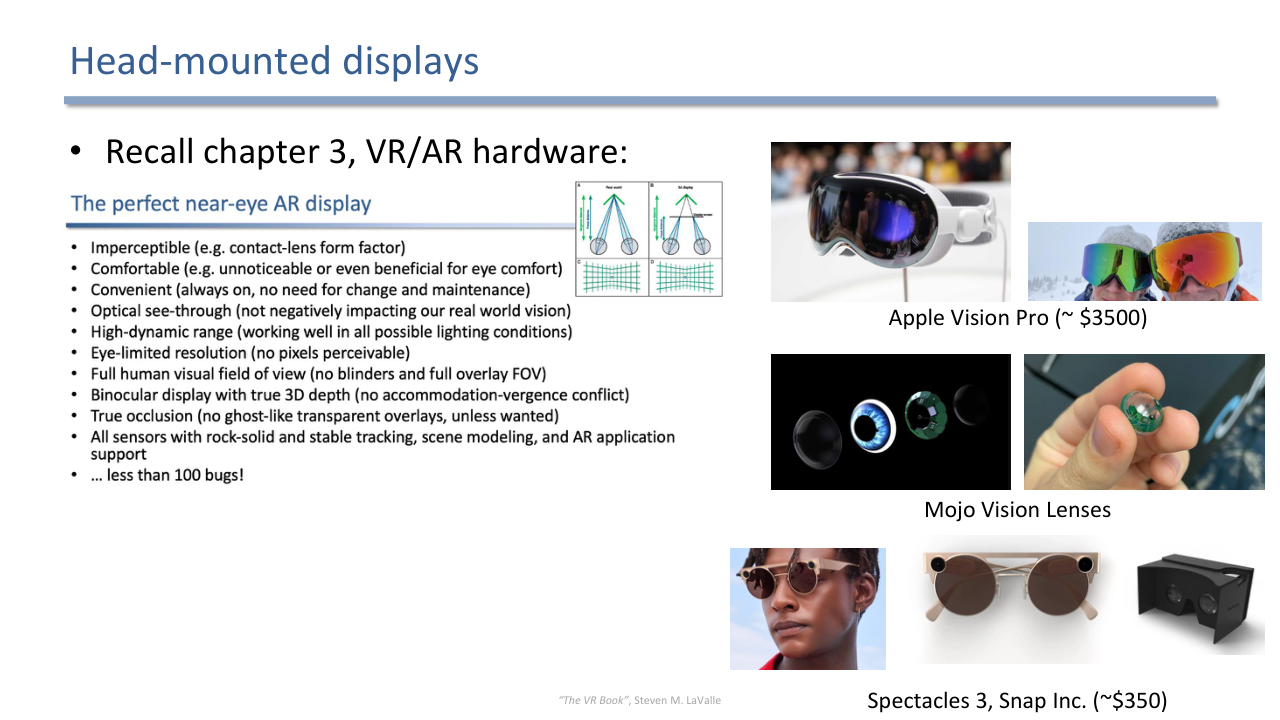
Future HMDs: Apple Vision Pro (~$3500), Mojo Vision contact lenses, Snap Spectacles 3 (~$350) - the hardware spectrum from high-end headsets to display contact lenses.
Head-mounted displays continue the trajectory from the hardware chapter: Apple Vision Pro (~350). On the optics front, Magic Leap claims to be solving the accommodation-vergence conflict, and Ebner et al. (“Video See-Through Mixed Reality with Focus Cues”, IEEE VR 2022) can adjust focal distance based on real-time measurements of the user’s vergence distance in video see-through.
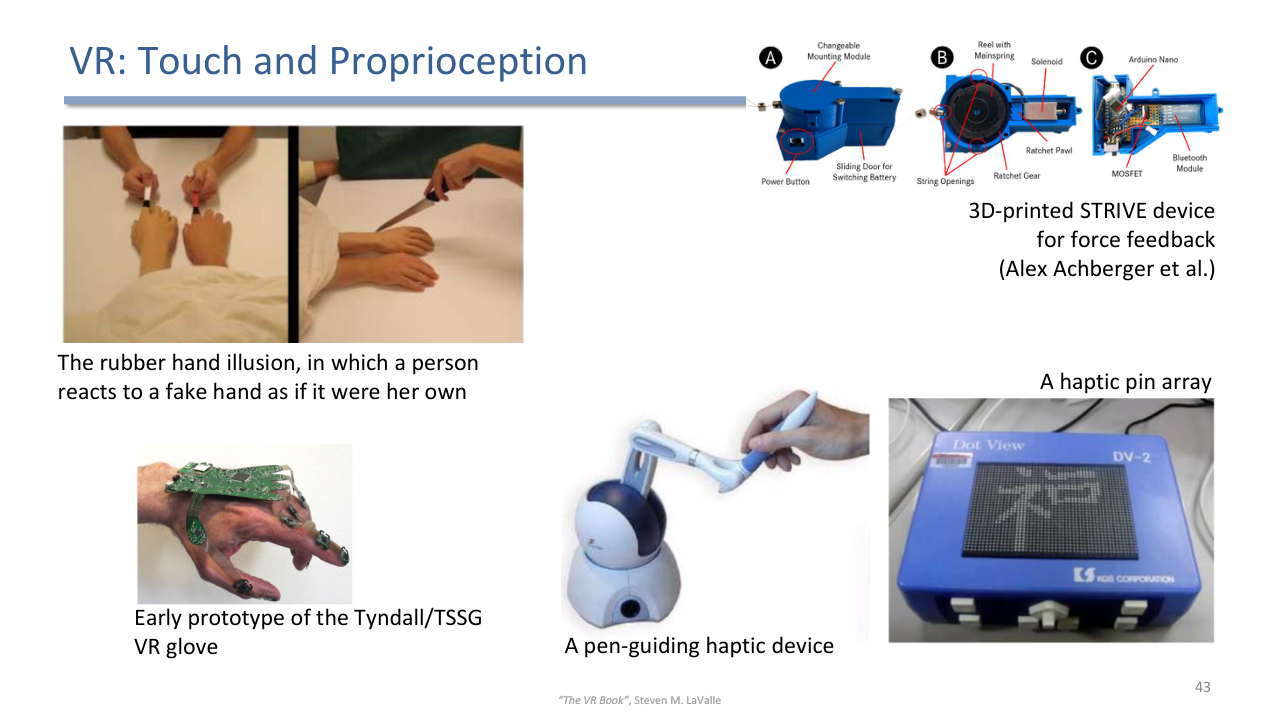
Touch and proprioception research: pen-guiding haptic devices, the rubber hand illusion, haptic pin arrays, the 3D-printed STRIVE force feedback device, and early VR glove prototypes.
Touch and proprioception (continuing the haptics lecture): pen-guiding haptic devices, the rubber hand illusion (a person reacts to a fake hand as if it were their own), haptic pin arrays, the 3D-printed STRIVE force feedback device (Achberger et al.), and early glove prototypes.
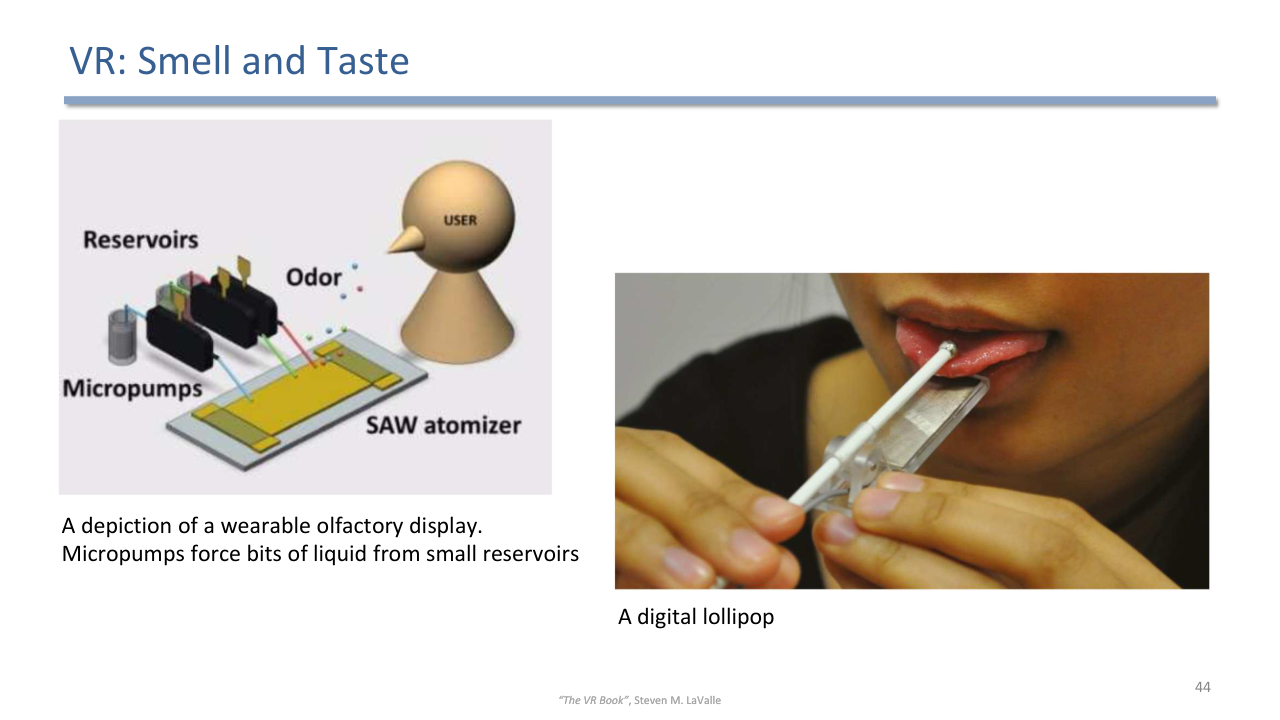
Smell and taste interfaces: a digital lollipop for taste stimulation and a wearable olfactory display where micropumps force liquid from small reservoirs.
Smell and taste: a digital lollipop for electrically stimulating taste, and wearable olfactory displays where micropumps release bits of liquid from small reservoirs.
Other trend lines:
- AR and smart objects: the Internet of Things gives control over the physical environment, but physical objects have no input or output of their own; AR provides direct manipulation of their parameters in place.
- Robotic interfaces: humanoid robots (HRP-4) and telepresence robots (the Double, a screen and camera on a stick) as embodiments for remote users.
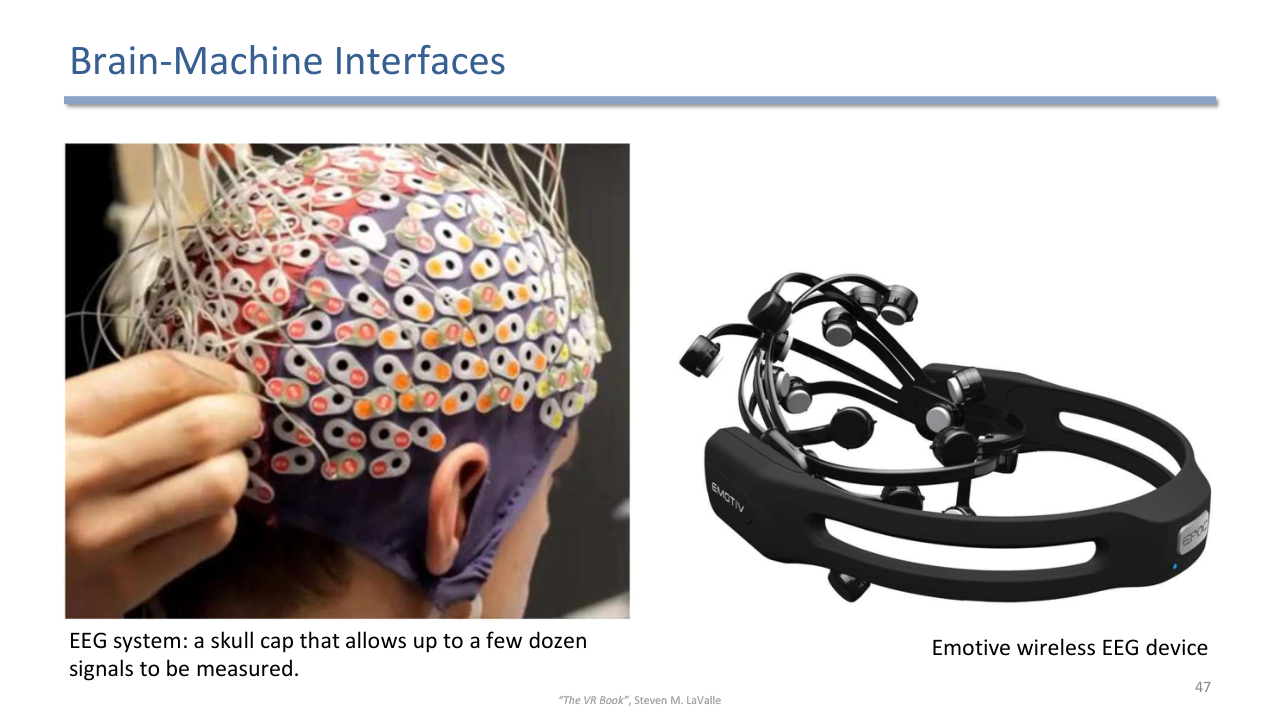
Brain-machine interfaces: EEG skull caps measuring up to a few dozen signals and wireless consumer EEG devices (Emotiv) as a speculative input path for VR/AR.
- Brain-machine interfaces: EEG systems (skull caps measuring up to a few dozen signals, wireless Emotiv devices) as a possible long-term input channel.
- Software: toolkits are much needed to improve the usability of VR/AR development (e.g. RagRug for situated analytics, Fleck et al., TVCG 2023; usable tracking, Haischt et al., AutoUI 2023). Meanwhile ML/AI has turned computer graphics and computer vision upside down: video inpainting, SLAM, merging the real and the virtual.
- Semantic understanding of the world: ConceptGraphs (ICRA 2024) builds open-vocabulary 3D scene graphs for perception and planning, which gives AR systems a semantic model of the scene on top of its geometry.
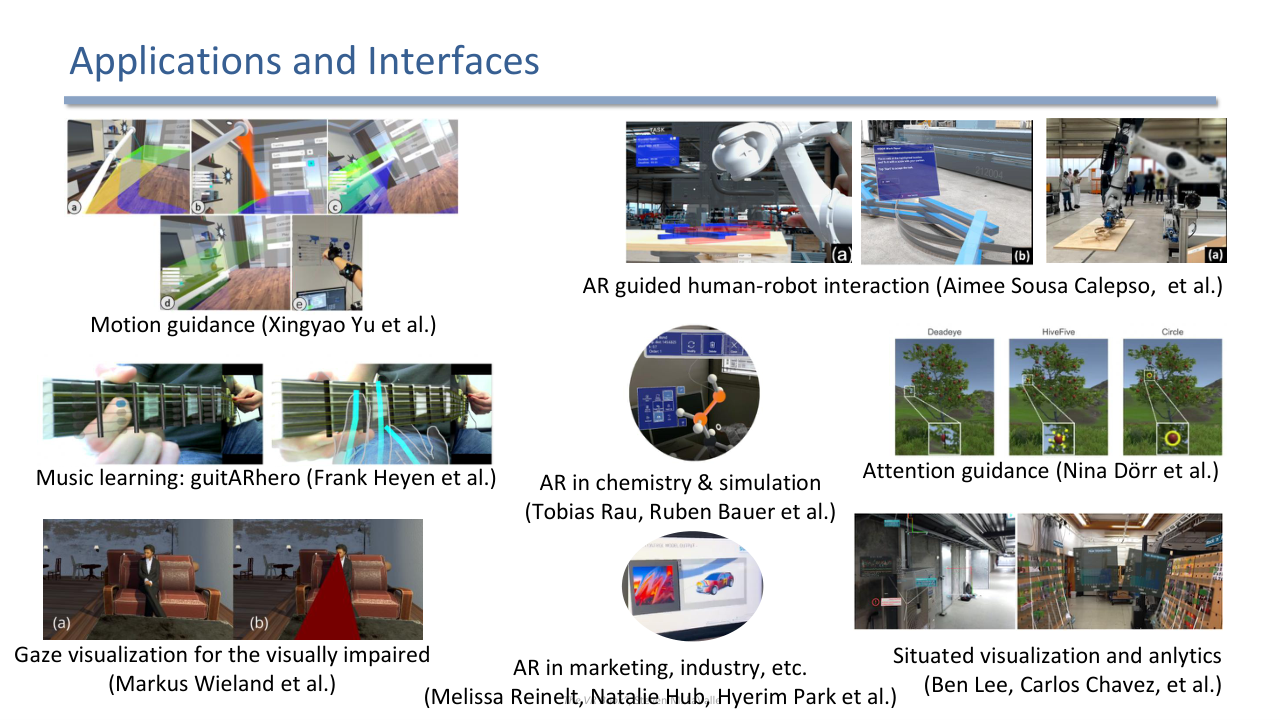
Application frontier from the group's research: motion guidance, guitARhero for music learning, gaze visualization for the visually impaired, attention guidance, AR-guided human-robot interaction, AR in chemistry, situated visualization, and AR in marketing and industry.
- Standards and open source: open source is a licensing class; a de facto standard dominates through sheer adoption (DirectX, Steam OS, LiquidVR, GameWorks VR); open standards are developed and maintained via a collaborative, consensus-driven process available to the public [ITU-T 2015], with the Khronos Group (OpenGL, OpenCL, WebGL) as the working example of a non-profit standards organization.
- Applications and interfaces from current research: motion guidance, music learning (guitARhero), gaze visualization for the visually impaired, attention guidance, AR-guided human-robot interaction, AR in chemistry and simulation, situated visualization and analytics, AR in marketing and industry.
🧠 Deep Dive: Reading the Trends as a Checklist of Gaps
Each trend answers a limitation met earlier in the course: varifocal displays attack the accommodation-vergence conflict (lecture 10), haptics and olfactory displays attack the missing senses (lecture 12), semantic scene understanding attacks the shallow world model behind visual coherence and situated visualization (lectures 08 and 11), toolkits attack the development cost that keeps studies small (this lecture), and standards attack fragmentation. The future-trends list is really the course’s list of open problems.
Exam Focus
- Goals of evaluation: understand fundamentals (when is AR/VR more effective) and gain insights (design guidelines); HMDs can cause more stress than 2D technologies.
- Human subjects (variability, ethics boards), dependent versus independent variables, evaluation of versus with VR/AR.
- Method toolbox from graphics (result inspection, benchmarking) and HCI (usability testing, walkthroughs, expert reviews, controlled experiments, field studies); demographics first.
- Operationalizing hypotheses into measures (completion time, score, task load); the novelty effect and longitudinal studies.
- VR sickness symptoms (nausea, dizziness, drowsiness, headache, fatigue, eyestrain) and the SSQ; SUS for whole-system usability; NASA TLX for task load; interviews and the weaknesses of self-report.
- Ethics and data protection, pilot studies (3-5 participants), good practices (no distractions, no leading questions, resting periods).
- Descriptive versus inferential statistics; control variables (confidence versus generalization) and confounding variables (ice cream and shark attacks); exploratory versus confirmatory studies.
- Case study: HHD versus HMD for AR assembly (SUS 69/74 versus 78/76; HMD preferred for object-handling tasks; task complexity drives interface choice).
- Future trends: varifocal/vergence-adaptive displays, touch/smell/taste interfaces, AR for smart objects, robotic and brain-machine interfaces, ML/AI upheaval, semantic scene graphs (ConceptGraphs), open standards (Khronos).
Self-Check
- What is the difference between evaluation of VR/AR and evaluation with VR/AR?
Answer
Evaluation of VR/AR studies the immersive system itself: its usability, effectiveness, comfort, and the design guidelines that can be inferred. Evaluation with VR/AR uses the technology primarily as an instrument to study another question, for example using VR as a controlled environment to study AR before building it, or simulating environments to investigate questions that would be technically or ethically impossible to study otherwise.
- Define dependent, independent, control, and confounding variables, with an example of each.
Answer
Dependent variables are the measures used to test a hypothesis (e.g. task completion time). Independent variables are the conditions directly manipulated by the scientist (e.g. HMD versus paper tutorial). Control variables are held fixed through subject or trial selection (e.g. only males aged 18 to 21), which increases confidence in the results but decreases generalization. Confounding variables make the independent and dependent variables appear correlated, with the correlation disappearing once the confounder is known: ice cream sales and shark attacks are correlated only because the weather drives both.
- Turn these three expectations into concrete measures: learning faster in VR, scoring higher with AR, feeling less tired in VR.
Answer
“Participants using VR will learn faster than participants using paper tutorials” is measured by task completion time. “Participants using AR will score higher in the test” is measured by the test score. “Participants using VR will feel less tired when performing the task” is measured by the task load or effort, for example with NASA TLX.
- What is the novelty effect and how is it addressed?
Answer
The novelty effect is the risk that users like a VR application because it is shiny and new rather than because it actually helps their use case. It is overcome by repeated exposure, such as longitudinal studies, where the novelty wears off across sessions. It can also distract the study conductor, so a fixed protocol should be followed.
- Name the standard questionnaires for sickness, usability, and task load, and what each measures.
Answer
The Simulator Sickness Questionnaire (SSQ) evaluates motion sickness symptoms; alongside it, experimenters must ensure participants feel well and never force them to continue under strong discomfort. The System Usability Scale (SUS) measures how users perceived the system as a whole, producing a 0-100 score from ten standard items. The NASA TLX measures perceived task load across mental, physical, and temporal demand, performance, effort, and frustration.
- What are the weaknesses of self-reported metrics?
Answer
Users can be unreliable and there is always a bias; the order of questions can matter (stereotype threat); participants may already be too tired to give complete answers in an interview; and cultural differences can impact the results. The countermeasure is to evaluate with as many people as possible and to complement self-report with objective measures, video recordings, and recordings of what the participant sees in the virtual world.
- What is the purpose of a pilot study, and how large is it?
Answer
A pilot study runs the design with a small number of participants (3 to 5) to gain information for refining it: whether the results are reasonable, whether the task is too easy or too hard to produce meaningful results, and how long one participant takes. If possible, the design is refined and piloted again before the main study.
- Distinguish descriptive from inferential statistics and name examples of each.
Answer
Descriptive statistics summarize the collected data: central tendency (mode, mean, median), variability (range, variance, standard deviation), and measures of relationships (correlations). Inferential statistics use tests to find significant differences between groups and conditions: parametric and non-parametric tests such as the t-test and ANOVA. Analyzing confidence intervals is a good alternative to significance testing, as argued by Cockburn et al. in the context of the replication crisis in empirical computer science.
- Summarize the asymmetric AR assembly case study: setup, results, takeaways.
Answer
Aygün et al. (IEEE VRW 2025) compared instruction conveyance for collaborative sorting and assembly tasks using asymmetric AR setups: a handheld display versus a head-mounted display. SUS scores were 69 (sorting) and 74 (assembly) for the HHD versus 78 (sorting) and 76 (assembly) for the HMD, complemented by NASA TLX and task questions. Takeaways: users preferred the HMD for tasks requiring more object handling (such as sorting), side effects like physical discomfort and UI difficulties varied per participant, and the complexity of the task directly impacts the interaction and the choice of interface.
- Name five future-trend directions from the outlook and one concrete example for each.
Answer
Any five of: displays solving the accommodation-vergence conflict (Magic Leap’s claims; Ebner et al.’s vergence-driven focus in video see-through); touch and proprioception (STRIVE force feedback, rubber hand illusion, pin arrays); smell and taste (digital lollipop, wearable olfactory displays with micropumps); AR for smart objects (direct manipulation of IoT parameters in place); robotic interfaces (HRP-4 humanoids, Double telepresence robot); brain-machine interfaces (EEG caps, Emotiv wireless EEG); software and ML/AI (RagRug toolkit, video inpainting, SLAM); semantic understanding (ConceptGraphs open-vocabulary 3D scene graphs); standards and open source (Khronos Group with OpenGL, OpenCL, WebGL versus de facto standards like DirectX).