Previous: (y-10) Adverse Health Effects in VR | AR Index | Next: (y-12) Haptics
Mental Model First
- Immersive analytics (IA) is the use of engaging, embodied analysis tools to support data understanding and decision making (Dwyer et al. 2018). In practice it means using highly immersive display and interaction technologies (VR, AR, display walls) for data visualization and analysis, instead of a flat desktop monitor and mouse.
- IA sits at the intersection of several fields: data visualization, visual analytics, virtual reality, computer graphics, and human-computer interaction. Its goal is to remove barriers between people, their data, and their tools, so analysis can happen everywhere, by anyone, individually or collaboratively.
- There are two distinct purposes. Visual analytics is analytical reasoning supported by interactive visual interfaces. Data-driven storytelling is communicating insights and telling stories to an audience with data. The first cares about task performance, the second about engagement and memorability.
- The case for going immersive rests on eight advantages: a third spatial channel, immersion and presence, spatial workspaces and spatial memory, collaboration, embodied interaction, multimodal input, hybrid interfaces, and situated visualization. The case against is the difficulty of evaluation, the historical skepticism toward 3D for abstract data, plus cybersickness and limited processing power.
- Situated visualization is the second half of the lecture: a visualization displayed in and semantically related to its physical environment. It is distinguished from non-situated and embedded visualization by how close it sits to its physical referent, and it is what AR is uniquely good at delivering hands-free and in-situ.
1. What Is Immersive Analytics
Immersive analytics builds on data visualization, visual analytics, virtual reality, computer graphics, and HCI. Its goal is to remove barriers between people, their data, and their analysis tools, supporting understanding and decision making everywhere and by everyone (Marriott et al.; Dwyer et al. 2018).
The working definition is Dwyer et al. (2018): “Immersive Analytics is the use of engaging, embodied analysis tools to support data understanding and decision making.” Today the term refers to using highly immersive display and interaction technologies for data visualization, analytics, and understanding.
The two goals that motivate the field:
- Remove barriers between people, their data, and the tools they use for analysis.
- Support understanding and decision making everywhere and by everyone, whether working individually or collaboratively.
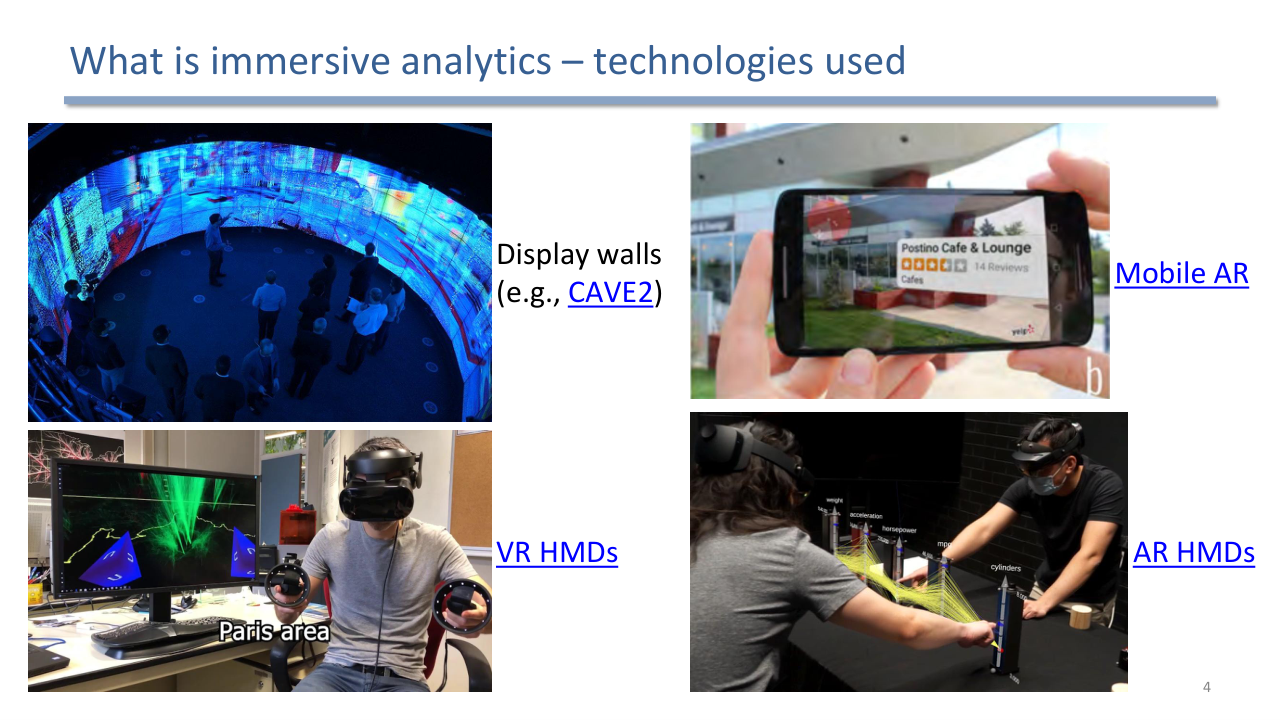
The technologies of immersive analytics span large display walls (e.g. CAVE2), VR headsets, AR headsets, and mobile AR. Each offers a different balance of immersion, field of regard, and connection to the real world.
IA is not tied to a single device. It runs on display walls such as CAVE2, VR HMDs, AR HMDs, and mobile AR. The common thread is more display space and more natural interaction than a desktop monitor provides.
2. Two Purposes: Analysis and Storytelling
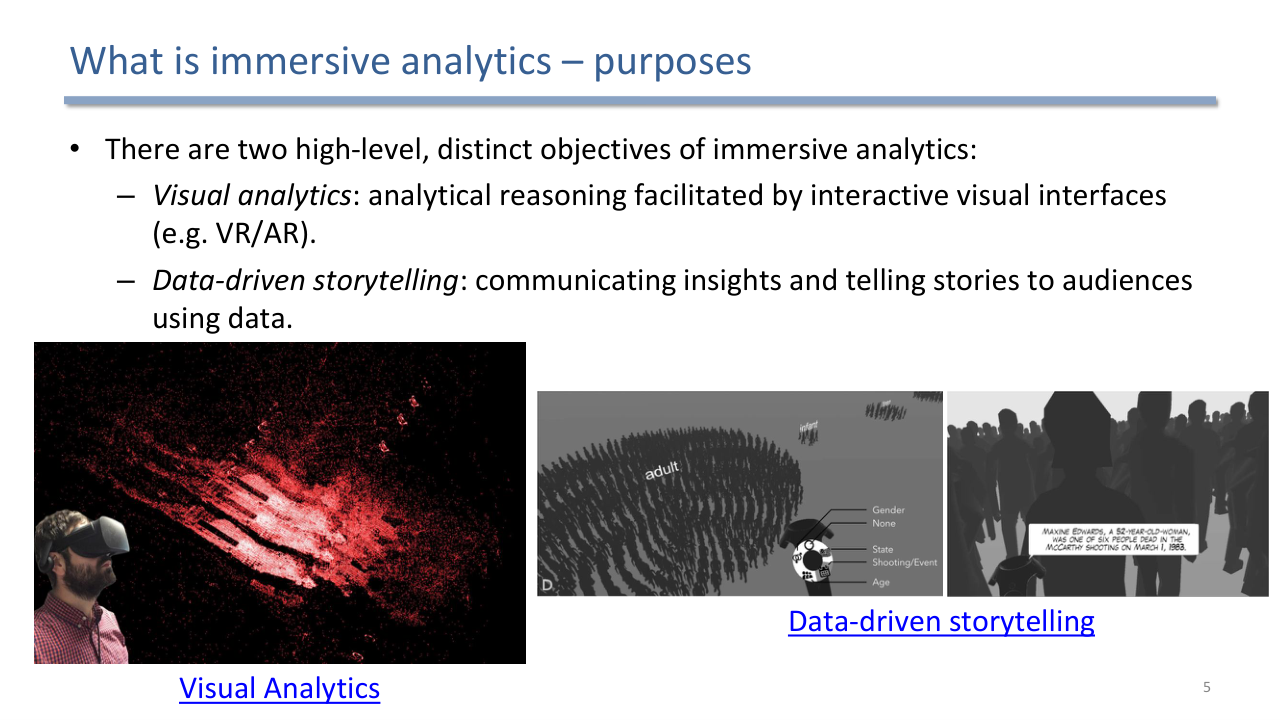
Immersive analytics serves two distinct objectives: visual analytics (analytical reasoning through interactive visual interfaces) and data-driven storytelling (communicating insights and telling stories to an audience).
There are two high-level objectives, and they pull evaluation in different directions:
- Visual analytics: analytical reasoning facilitated by interactive visual interfaces. Success is measured by accuracy and speed on a task.
- Data-driven storytelling: communicating insights and telling stories to audiences using data. Success is measured by engagement, enjoyment, and memorability.
Keeping these two apart matters, because a design that is good for one is not automatically good for the other.
3. A Brief History
As data grew into Big Data, tools had to keep pace. Chandler et al. coined "immersive analytics" in 2015, aligned with the release of the Oculus Rift and HTC Vive that commoditized VR.
The roots go back decades. In 1986 Furness envisioned the Super Cockpit, a theoretical AR display giving pilots visual, tactile, and auditory information in-situ. Ribarsky et al. (1994) and Bryson (1996) demonstrated VR for visualizing scientific data such as molecules and airflow.
Because scientific data is typically three-dimensional in nature, VR and AR were a natural fit for scientific visualization (microscopy, CT/MRI). Abstract, multidimensional data (information visualization) was underexplored, since it has no inherent 3D structure and is therefore not as natural a candidate. As data grew into Big Data, the need for better tools became clear, and in 2015 Chandler et al. coined the term immersive analytics, aligned with the Oculus Rift and HTC Vive commoditizing VR.
4. Why VR/AR over the Desktop?
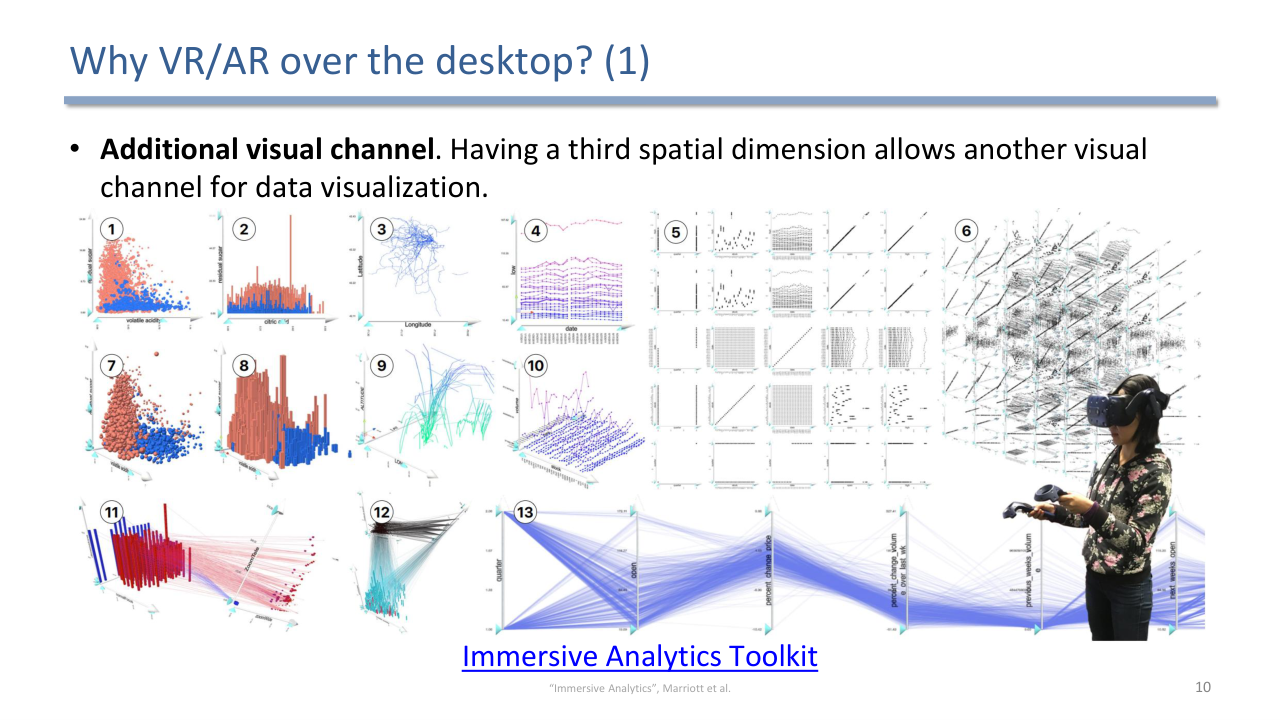
The first advantage: a third spatial dimension gives an additional visual channel for encoding data beyond what a 2D display offers.
The lecture lists eight advantages of immersive analytics over a conventional desktop:
- Additional visual channel: a third spatial dimension is one more channel for encoding data.
- Immersion, presence, and engagement: analysts get into a flow state, which raises task effectiveness, and higher engagement makes data stories more enjoyable.
- Spatial workspaces and spatial memory: the space around the analyst becomes the workspace, not a small physical display, and spatial memory aids performance.
- Effective collaboration: groups solve problems together in a shared virtual workspace.
- Embodied data exploration: controllers and hand tracking let users manipulate visualizations like real objects.
- Multimodal data exploration: hand tracking, voice, gaze and eye tracking, and tangible controllers can be combined.
- Hybrid user interfaces: AR extends familiar desktop and tablet tools with a virtual 3D space, getting the best of both.
- Situated visualization and analytics: data is visualized in-situ with AR, aiding decisions within the data’s physical context.
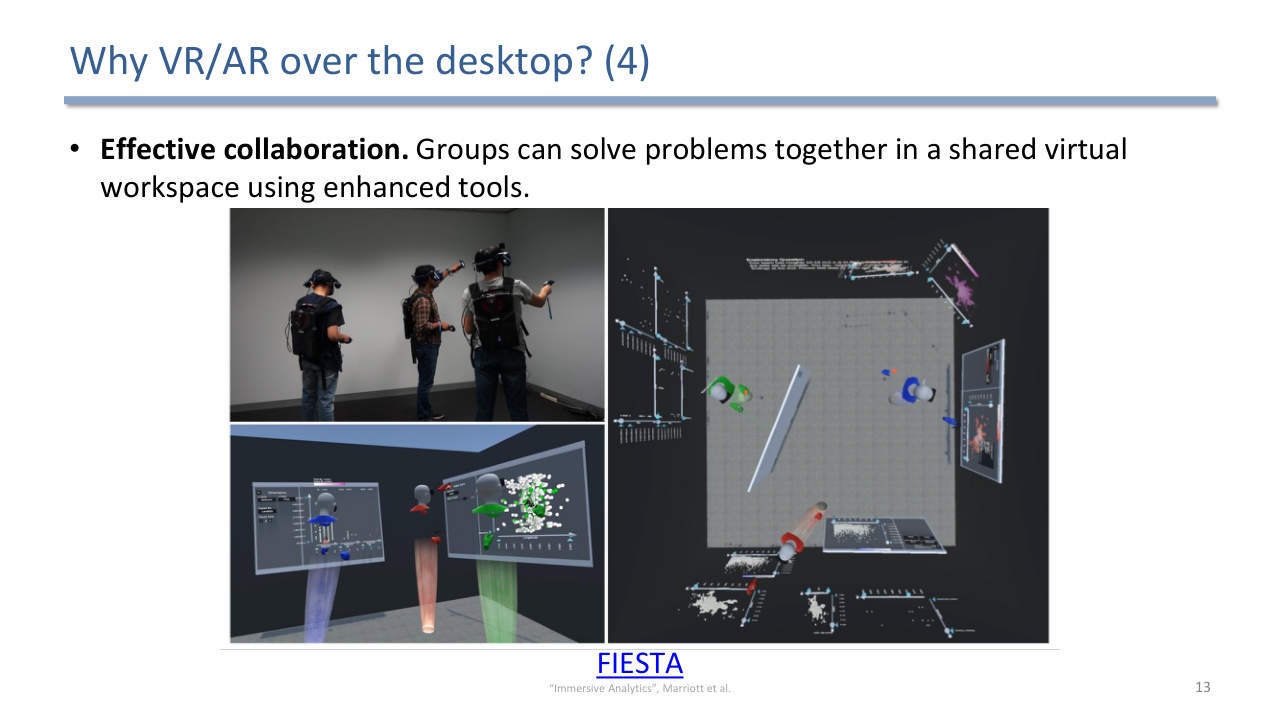
Effective collaboration: systems like FIESTA let groups work together in a shared virtual workspace with enhanced tools, something a single desktop monitor cannot easily support.
💡 Intuition
Each advantage corresponds to a property of immersive systems that a desktop lacks: a real third dimension, surrounding space, embodied input, and a direct link to the physical world. The more of these an application leverages, the harder it also becomes to compare it fairly against a desktop baseline, which is the central evaluation problem in section 6.
5. Situated Visualization as an Advantage
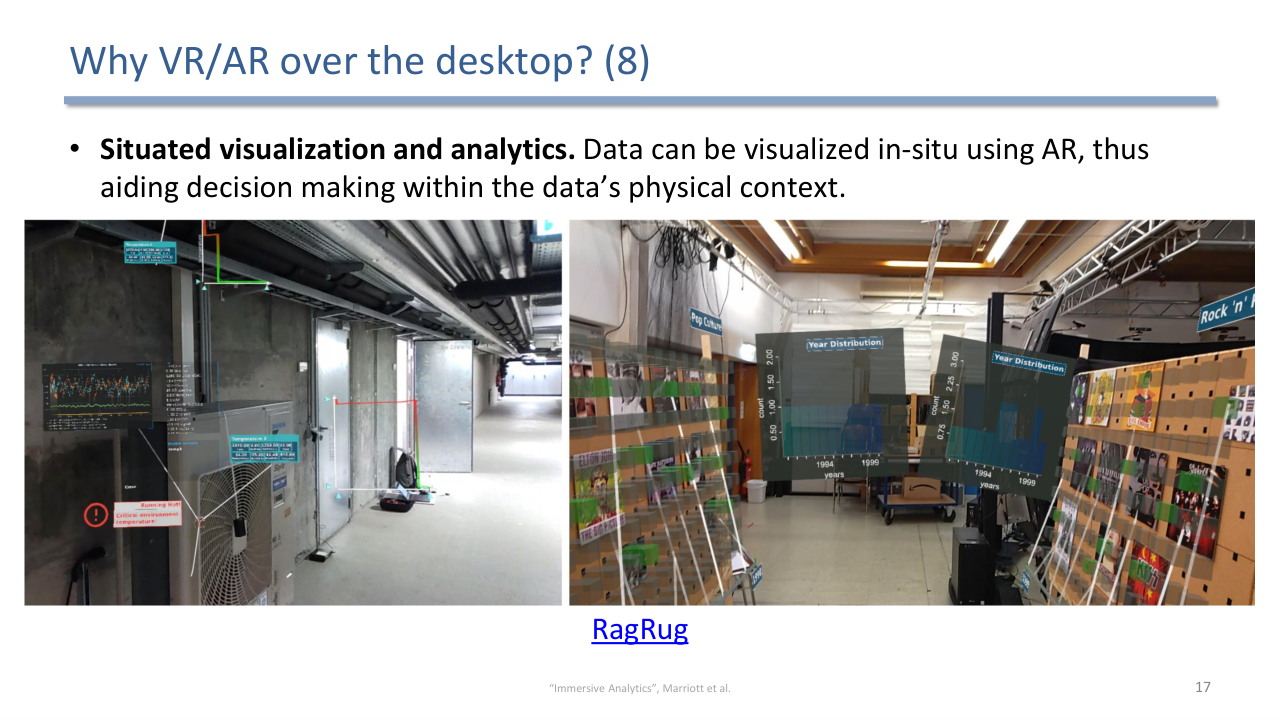
Situated visualization (e.g. RagRug) shows data in-situ with AR, so decisions can be made within the data's real physical context rather than on a separate screen.
The eighth advantage, situated visualization, is important enough that the second half of the lecture is devoted to it. The idea is to place the visualization in the physical context the data is about, so the analyst reasons in-situ instead of mentally mapping between a screen and the world.
6. Is It Actually Useful? Evaluation
Comparing immersive tools to desktops is hard: the more VR/AR characteristics a system leverages, the further it is from a desktop baseline. Hybrid interfaces sidestep the comparison by using both together.
Are immersive technologies actually better than conventional desktop tools? The honest answer is that it is hard to say:
- The devices are too different to compare cleanly, like comparing a tablet with a smartwatch.
- The more VR/AR characteristics a system leverages (embodiment, spatiality, novel input), the further it gets from any desktop baseline, so the comparison gets harder.
- Hybrid user interfaces avoid the problem by using VR/AR and conventional tools together.
- Cybersickness and processing power remain constraints, expected to improve as the technology matures.
Evaluation also needs to broaden. Visualization research has traditionally focused on task performance (accuracy and speed), but immersive analytics may need to weigh emotional engagement, enjoyment, and memorability too, especially for data-driven storytelling where VR/AR can captivate audiences in ways other devices cannot.
7. Reconsidering 3D for Information Visualization
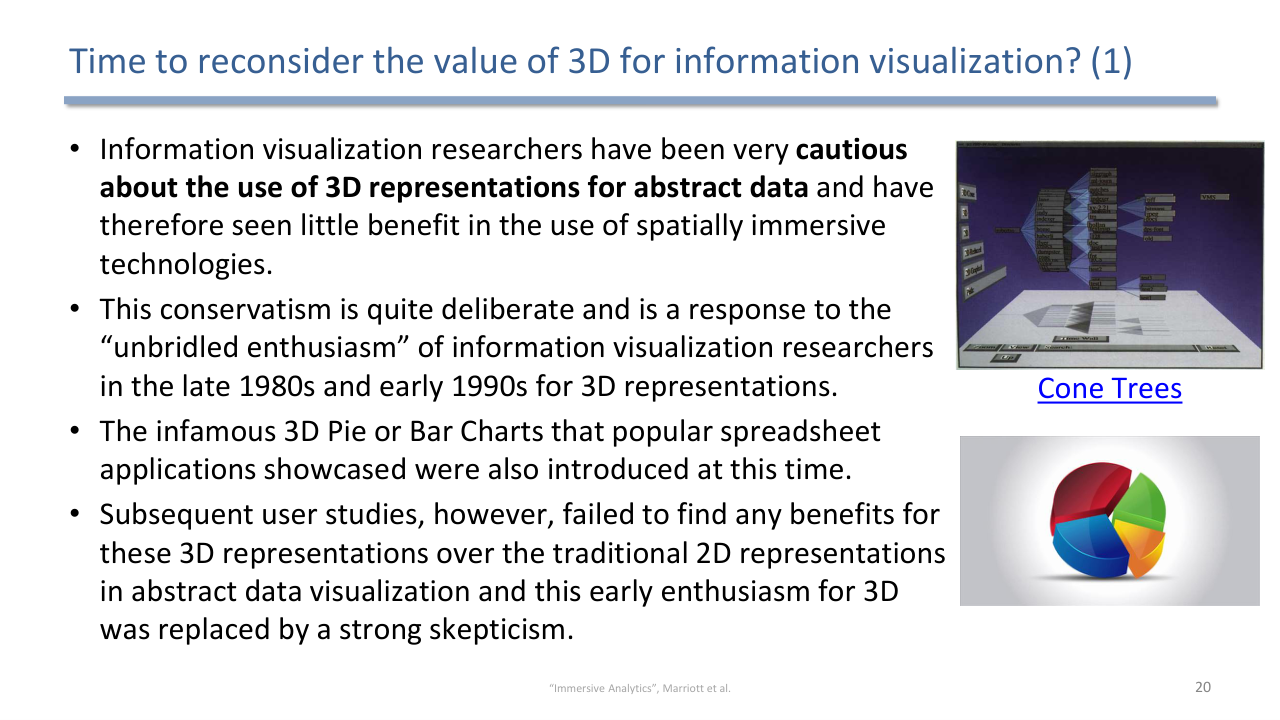
Infovis researchers grew skeptical of 3D for abstract data after the "unbridled enthusiasm" of the late 1980s and 1990s (think 3D pie and bar charts) failed to beat 2D in user studies.
Information visualization researchers have long been cautious about 3D for abstract data. The skepticism is deliberate, a reaction to the “unbridled enthusiasm” for 3D in the late 1980s and early 1990s, when 3D pie and bar charts appeared in spreadsheet software. User studies failed to find any benefit of those 3D representations over 2D, and enthusiasm turned to skepticism.
That does not mean 3D is never useful. It has value for overviews of multidimensional data, networks, and 3D terrain, and proper depth cues (occlusion, parallax) plus interactivity mitigate the classic pitfalls. The pragmatic guidance: use 3D sparingly, only when the task needs it, and otherwise place 2D visualizations within the 3D space.
🧠 Deep Dive: Why Abstract Data Resists 3D
Scientific data such as a CT scan or an airflow field already lives in three dimensions, so showing it in VR is just matching the display to the data. Abstract data (sales figures, social networks) has no inherent spatial structure, so any 3D layout is a designer’s invention. The extra dimension then adds occlusion, perspective distortion, and navigation cost without a guaranteed payoff, which is exactly what the 1990s studies found. Immersive analytics revisits the question because immersion, head-tracked parallax, and interaction change the cost-benefit balance that those early flat-screen 3D studies measured.
8. What Is Situated Visualization?
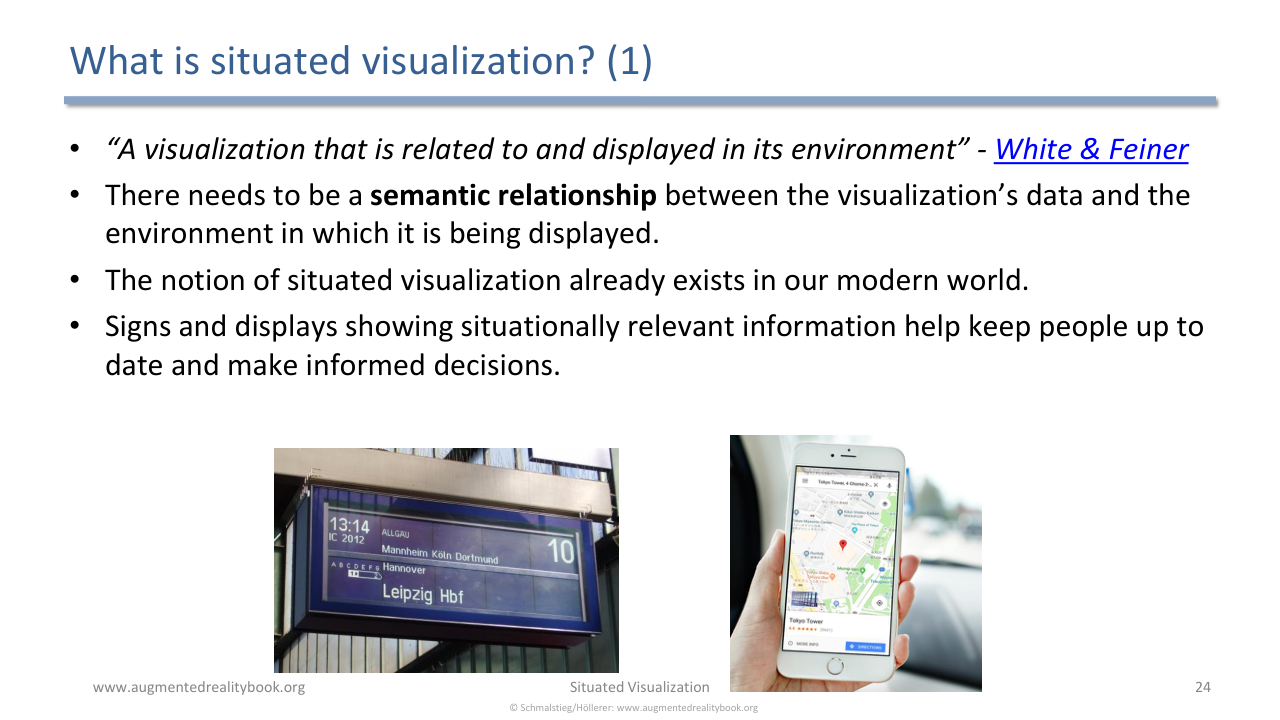
A situated visualization is "a visualization that is related to and displayed in its environment" (White and Feiner). It needs a semantic relationship between the data and the place it is shown, like signs and displays already do in the everyday world.
White and Feiner define a situated visualization as “a visualization that is related to and displayed in its environment.” The key requirement is a semantic relationship between the visualization’s data and the environment it is displayed in.
The notion already exists in the everyday world: signs and displays showing situationally relevant information help people stay informed and make decisions, including in professional contexts. The catch is that existing situated displays require knowing where the visualization is and usually require the use of one’s hands. AR removes both limits: it shows information in-situ without external displays, hands-free, and freely positioned in the environment. VR is generally not applicable for situated visualization, since situated visualization is about the real surroundings.
9. Situated Visualization vs. Situated Analytics
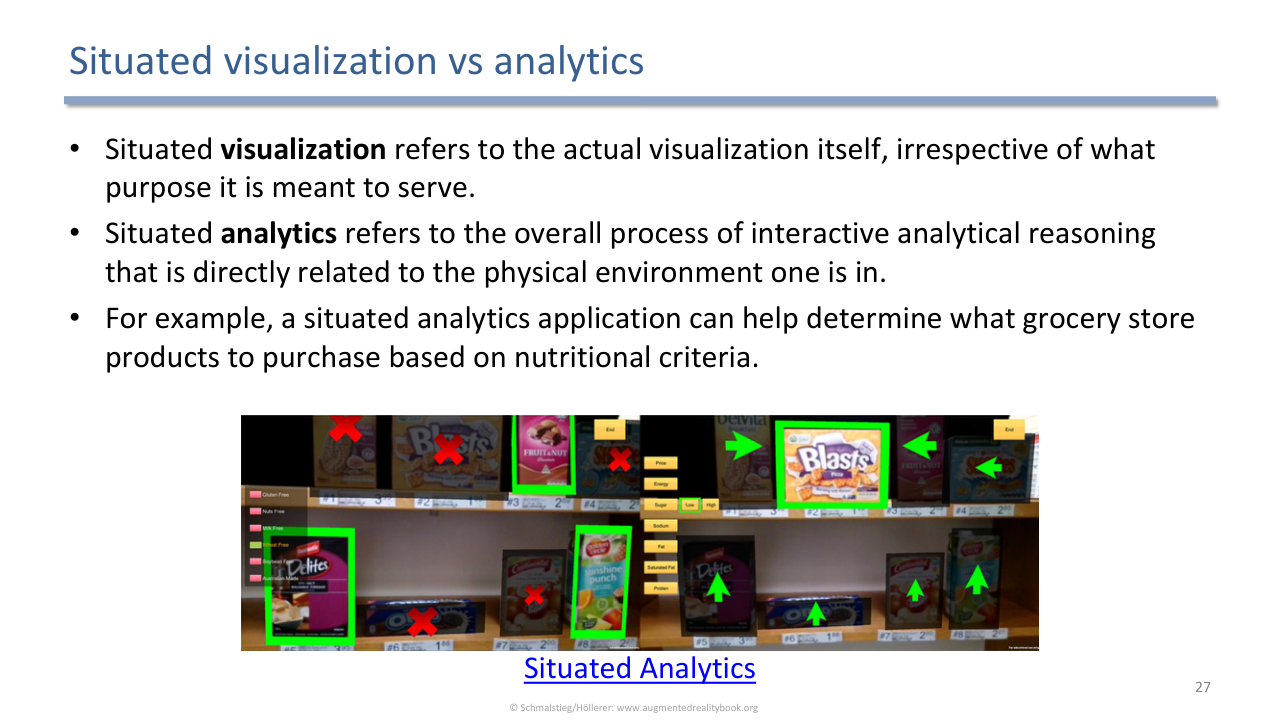
Situated visualization is the visualization itself; situated analytics is the whole interactive reasoning process tied to the physical environment, such as choosing groceries by nutritional criteria in the store.
Two related terms:
- Situated visualization is the visualization itself, irrespective of the purpose it serves.
- Situated analytics is the overall process of interactive analytical reasoning directly tied to the physical environment. For example, an app that helps decide which grocery products to buy based on nutritional criteria, while standing in the store.
A note on scope: the term situated visualization has expanded beyond abstract multivariate data (bar charts, scatter plots) to include any representation of information related to the environment.
10. Non-Situated vs. Situated vs. Embedded
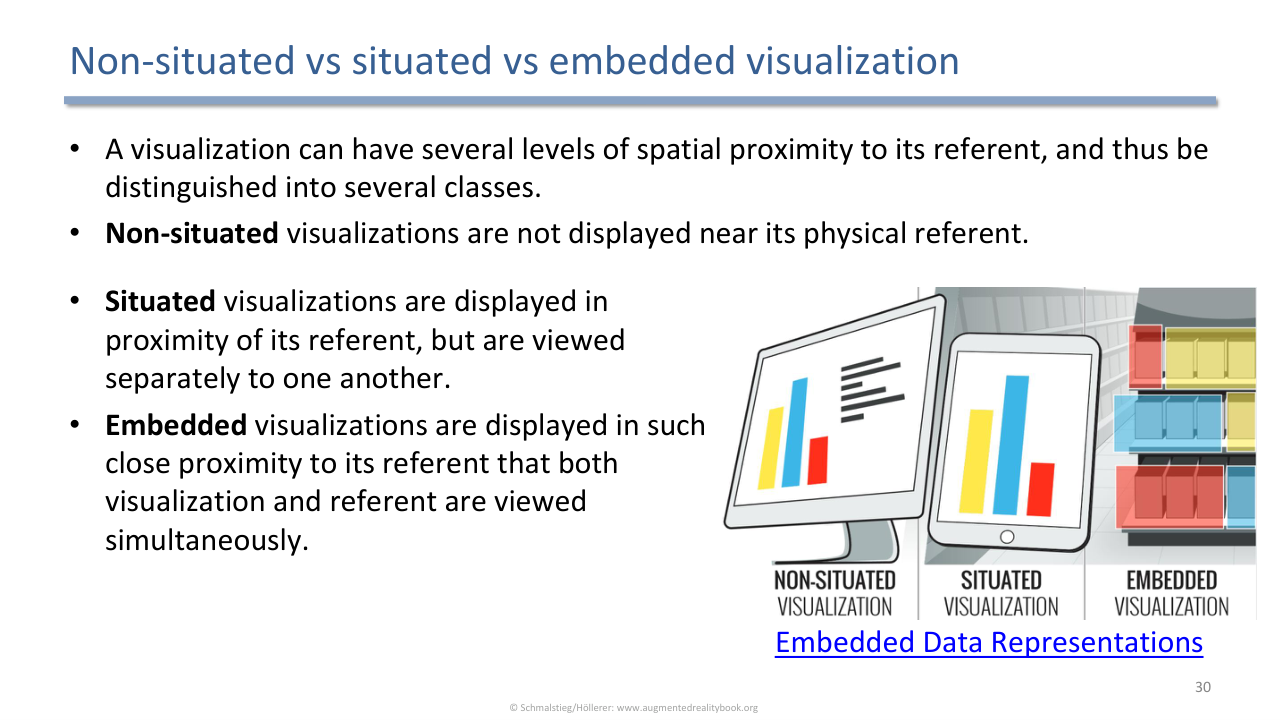
Three classes by spatial proximity to the referent: non-situated (not near the referent), situated (near the referent but viewed separately), and embedded (so close that visualization and referent are seen together).
A visualization relates to its physical referent, the physical space, object, or entity the data refers to (Willett et al. extend White and Feiner’s generic “environment” to this term). Proximity to the referent gives three classes:
- Non-situated: not displayed near its physical referent.
- Situated: displayed in proximity to the referent, but viewed separately from it.
- Embedded: displayed so close to the referent that the visualization and the referent are viewed simultaneously.
11. Forms and Examples of Situated Visualization
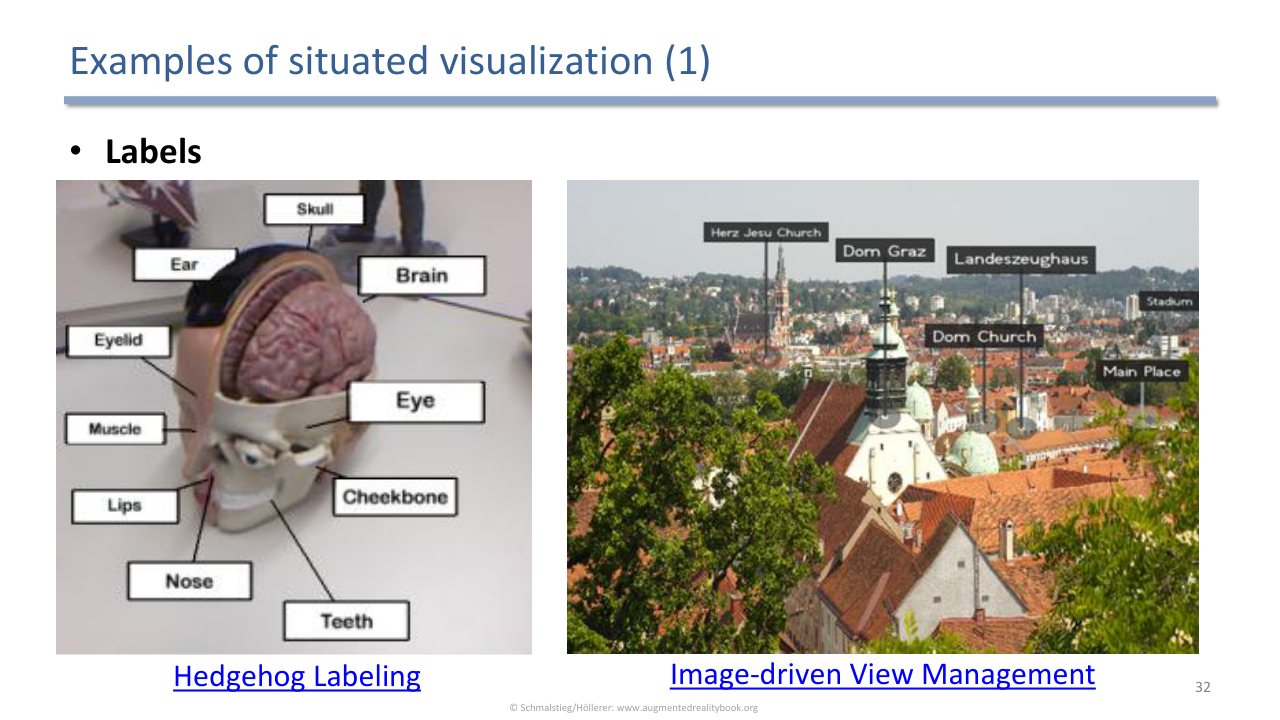
Labels are one of the simplest situated visualizations: techniques like Hedgehog Labeling and image-driven view management place text annotations on real-world objects without clutter.
The lecture catalogues recurring forms of situated visualization, each with example systems:
- Labels: text annotations on objects (Hedgehog Labeling, image-driven view management).
- Glyphs: small symbolic markers (maritime navigation assistance, AR Hero).
- Trajectories and flows: paths over space (urban simulation visualization, MIRIA).
- Magic lenses: a movable region revealing extra detail.
- Ghosts: showing hidden or future state (AR assembly instructions).
- Panels: 2D information surfaces placed in the scene (Corsican Twin, assembly tasks).
12. Enabling Technologies and Constraints
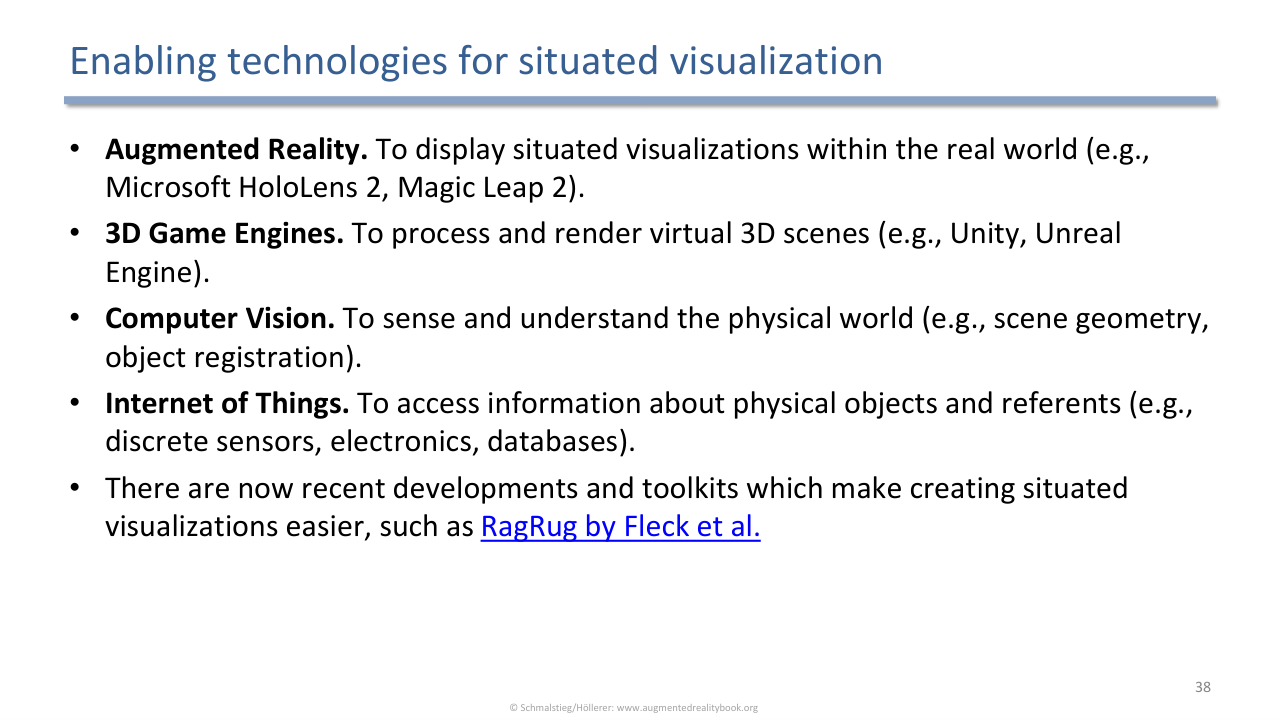
Situated visualization rests on four technologies: AR displays (HoloLens 2, Magic Leap 2), 3D game engines (Unity, Unreal), computer vision (sensing scene geometry and registering objects), and the Internet of Things (data about physical referents).
Four enabling technologies make situated visualization possible:
- Augmented Reality to display visualizations in the real world (HoloLens 2, Magic Leap 2).
- 3D game engines to process and render the virtual scene (Unity, Unreal).
- Computer vision to sense and understand the physical world (scene geometry, object registration).
- Internet of Things to access information about physical objects and referents (sensors, databases).
Toolkits such as RagRug (Fleck et al.) now make building these applications easier.
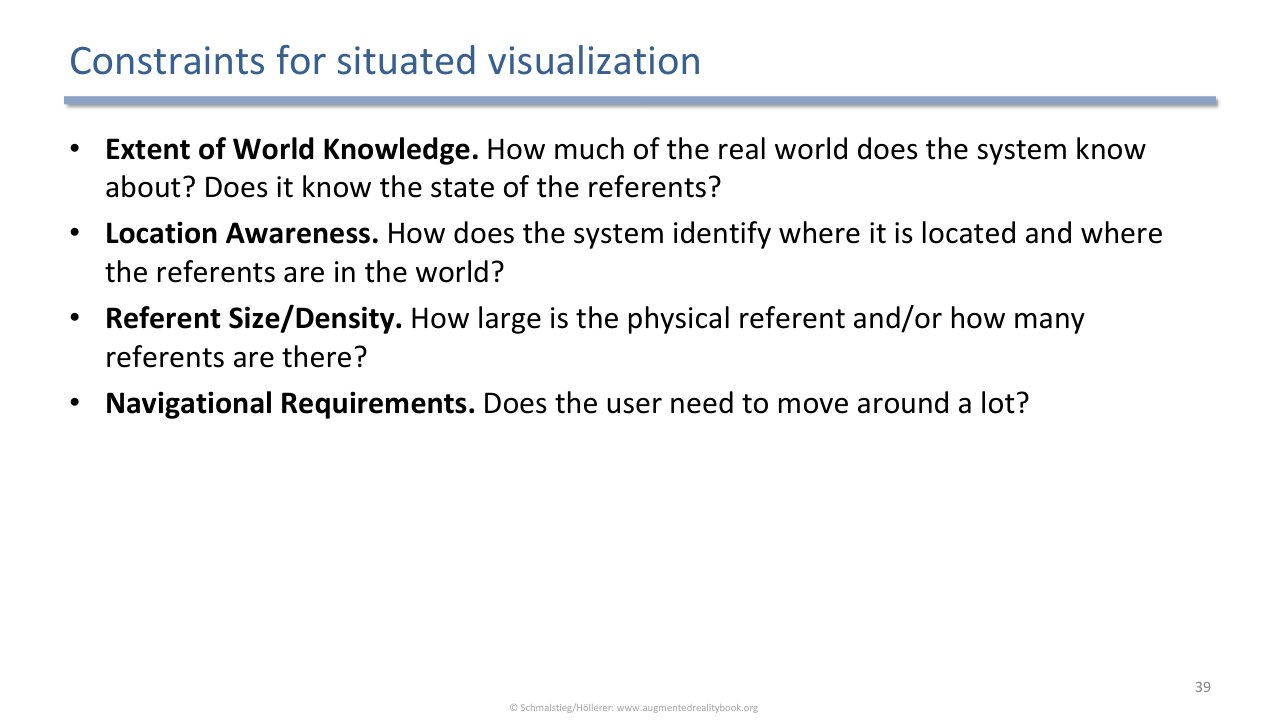
Four design constraints shape any situated visualization system: extent of world knowledge, location awareness, referent size and density, and navigational requirements.
Four constraints shape what a situated system can do:
- Extent of world knowledge: how much of the real world (and the referents’ state) does the system know?
- Location awareness: how does it identify where it and the referents are?
- Referent size and density: how large or how numerous are the referents?
- Navigational requirements: does the user have to move around a lot?
AR is well suited to deliver situated visualization hands-free and in-situ, supporting both physical tasks (navigation, manual assembly, surgery) and cognitive tasks (movement analysis, shopping, facility maintenance). Building it well is both an engineering and a user-experience challenge.
Exam Focus
- Immersive analytics definition (Dwyer et al. 2018) and its parent fields: data visualization, visual analytics, VR, computer graphics, HCI.
- Two purposes: visual analytics (analytical reasoning, measured by accuracy and speed) versus data-driven storytelling (measured by engagement and memorability).
- History: scientific data was a natural 3D fit, abstract data was not; the term was coined in 2015 (Chandler et al.) alongside commodity VR (Rift, Vive).
- The eight advantages over the desktop: extra visual channel, immersion/presence, spatial workspace and memory, collaboration, embodiment, multimodal input, hybrid interfaces, situated visualization.
- Evaluation is hard because the more VR/AR characteristics a system uses the further it is from a desktop baseline; hybrid interfaces sidestep it, and metrics should extend beyond task performance.
- The 3D-for-infovis debate: justified skepticism from the 1990s, but 3D still helps for overviews, networks, and terrain with proper depth cues.
- Situated visualization (White and Feiner): displayed in and semantically related to its environment; AR suits it, VR generally does not.
- Situated visualization versus situated analytics; physical referents (Willett et al.); non-situated versus situated versus embedded.
- Enabling technologies (AR, 3D game engines, computer vision, IoT) and four constraints (world knowledge, location awareness, referent size/density, navigational requirements).
Self-Check
- Give the Dwyer et al. (2018) definition of immersive analytics and name the fields it builds on.
Answer
“Immersive Analytics is the use of engaging, embodied analysis tools to support data understanding and decision making.” It builds on data visualization, visual analytics, virtual reality, computer graphics, and human-computer interaction. Its goals are to remove barriers between people, their data, and their tools, and to support understanding and decision making everywhere and by everyone, individually or collaboratively.
- What are the two distinct purposes of immersive analytics, and how does each change what you measure?
Answer
Visual analytics is analytical reasoning facilitated by interactive visual interfaces, evaluated mainly by task performance (accuracy and speed). Data-driven storytelling is communicating insights and telling stories to an audience, evaluated by engagement, enjoyment, and memorability. A design optimized for one is not automatically good for the other, so the evaluation criteria differ.
- Why was scientific data an early fit for VR/AR while abstract data lagged behind?
Answer
Scientific data (microscopy, CT/MRI, airflow, molecules) is typically three-dimensional in nature, so VR and AR simply match the display to data that already has 3D structure. Abstract, multidimensional data (information visualization) has no inherent 3D structure, so any spatial layout is invented by the designer, making it a less natural candidate. This is why early VR/AR visualization focused on scientific data, and the term immersive analytics was only coined in 2015 (Chandler et al.) as Big Data and commodity VR (Rift, Vive) arrived.
- List at least five of the eight advantages of VR/AR over the desktop for analytics.
Answer
Any five of: (1) additional visual channel from a third spatial dimension; (2) immersion, presence, and engagement leading to a flow state; (3) spatial workspaces and spatial memory using the space around the user; (4) effective collaboration in a shared virtual workspace; (5) embodied data exploration via controllers and hand tracking; (6) multimodal exploration combining hand, voice, gaze, and tangible input; (7) hybrid user interfaces blending AR with familiar desktop and tablet tools; (8) situated visualization and analytics, showing data in-situ with AR.
- Why is it so difficult to evaluate whether immersive analytics is better than desktop tools, and how do hybrid interfaces help?
Answer
VR/AR and desktops are very different devices with different use cases, like comparing a tablet with a smartwatch. The more VR/AR characteristics a system leverages (embodiment, spatiality, novel input), the further it gets from any desktop baseline, so a fair comparison becomes harder. Hybrid user interfaces sidestep the problem by using VR/AR and conventional tools together rather than pitting them against each other. Cybersickness and limited processing power are additional, separate constraints.
- Why are information visualization researchers skeptical of 3D for abstract data, and when is 3D still justified?
Answer
The skepticism is a deliberate reaction to the “unbridled enthusiasm” for 3D in the late 1980s and 1990s, when 3D pie and bar charts appeared in spreadsheets and subsequent user studies failed to find any benefit over 2D for abstract data. 3D is still justified for overviews of multidimensional data, networks, and 3D terrain, and proper depth cues (occlusion, parallax) plus interactivity mitigate its pitfalls. The guidance is to use 3D sparingly, only when the task needs it, or to place 2D visualizations within a 3D space.
- Define situated visualization and explain why AR suits it but VR generally does not.
Answer
A situated visualization is “a visualization that is related to and displayed in its environment” (White and Feiner), requiring a semantic relationship between the data and the place it is shown. AR can display this information in-situ without external displays, hands-free, and freely positioned in the real environment. VR is generally not applicable because situated visualization is about the real physical surroundings and their referents, which VR replaces with a virtual world.
- Distinguish non-situated, situated, and embedded visualization by their relationship to the physical referent.
Answer
The physical referent is the space, object, or entity the data refers to. Non-situated visualizations are not displayed near the referent. Situated visualizations are displayed in proximity to the referent but viewed separately from it. Embedded visualizations are displayed so close to the referent that the visualization and referent are viewed simultaneously. The three form a spectrum of increasing spatial proximity.
- Name the four enabling technologies for situated visualization and what each provides.
Answer
Augmented Reality displays the visualizations in the real world (HoloLens 2, Magic Leap 2). 3D game engines process and render the virtual 3D scene (Unity, Unreal). Computer vision senses and understands the physical world, including scene geometry and object registration. The Internet of Things provides access to information about physical objects and referents through sensors and databases. Toolkits such as RagRug combine these to ease development.
- What four constraints shape a situated visualization system?
Answer
Extent of world knowledge (how much of the real world and the referents’ state the system knows), location awareness (how the system identifies where it and the referents are), referent size and density (how large or numerous the referents are), and navigational requirements (how much the user must move around). These determine what kind of situated visualization is feasible for a given application.
Previous: (y-10) Adverse Health Effects in VR | AR Index | Next: (y-12) Haptics